The practical papers (5 and 6)
🎯What you need to be able to do
- Read burettes, thermometers, measuring cylinders, balances and stop-watches to the right precision.
- Record results in a table with headings and units, and plot a graph with a best-fit line or curve.
- Identify anomalous results, draw conclusions, and read values from a graph.
- Evaluate a method, suggest sources of error and improvements, and plan an investigation, including safety.
- Use the qualitative analysis notes (topic 12b) to identify ions and gases from observations.
📚The papers
Every candidate, Core or Extended, takes one of these, worth 20% of the grade:
Both test the same skills. The difference is only where the data come from, so revise the skills below whichever paper you sit.
Reading apparatus
- Burette: to the nearest 0.05 cm³, two decimal places (23.45, 0.00 — not 0). Read the bottom of the meniscus at eye level (topic 12a).
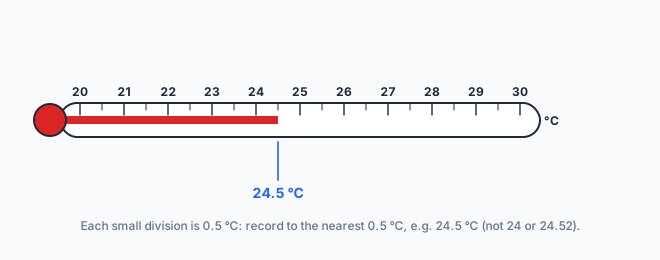
- Thermometer: usually to the nearest 0.5 °C, one decimal place.
- Measuring cylinder: to the nearest graduation, usually 0.5 or 1 cm³.
- Stop-watch: to the nearest second (reaction time makes hundredths meaningless).
Tables and graphs
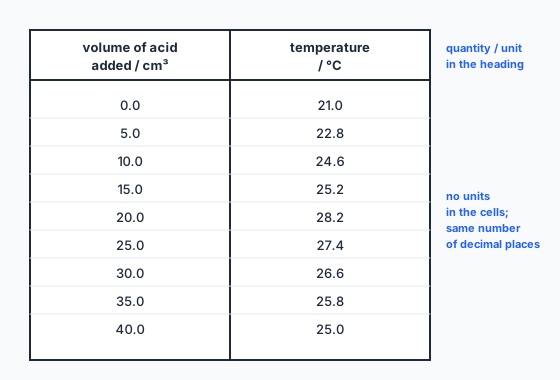
- Axes: independent variable on x, dependent on y; label both with quantity and unit.
- Scale: linear and easy to read (2, 5 or 10 per large square), with the points using more than half the grid. The axes need not start at zero.
- Points: small crosses, plotted to within half a small square.
- Line: a single best-fit straight line or smooth curve — never dot to dot. Ignore an anomalous point when drawing it.
Evaluating and planning
- Anomalous result: a point well away from the pattern. Suggest a cause specific to the method (a reading taken before the mixture was stirred, a misread scale, gas escaping before the bung was fitted).
- Improvements must be specific: “insulate the cup with a lid”, “use a burette instead of a measuring cylinder”, “take readings at smaller intervals near the end-point”, “repeat and take a mean”. “Be more careful” scores nothing.
- Variables: the independent variable is changed, the dependent variable is measured, controlled variables are kept the same.
- A plan names apparatus and quantities, the measurements to take, the variables to control, how to process the results, and one safety precaution linked to a real hazard.
✏️Worked example
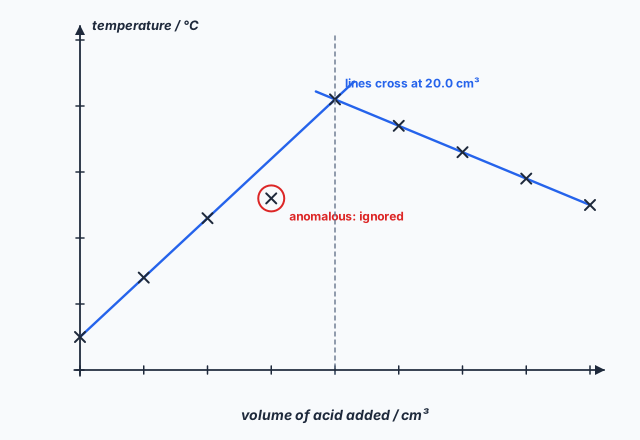
(a) See the graph: one line through the rising points, a second through the falling points, extended until they cross.
(b) 15.0 cm³, 25.2 °C: it is 1.2 °C below the line. The reading was probably taken before the temperature had reached its maximum (or before the mixture was stirred).
(c) 20.0 cm³, where the lines cross (the maximum temperature, 28.2 °C).
(d) Add a lid to reduce heat loss, or add the acid in smaller portions (1.0 cm³) near 20 cm³.
📝Practise
In the style of Papers 5 and 6.
1. A burette reads 1.20 cm³ at the start and 24.65 cm³ at the end. Calculate the volume added. [1]
2. Titres of 24.10, 23.35, 23.50 and 23.55 cm³ were recorded; the first was a rough titration. Which titres are concordant, and what is their mean? [2]
3. A student records a temperature as “24” from a thermometer marked every 0.5 °C. What is wrong, and how should it be written? [1]
4. In an investigation of how the concentration of hydrochloric acid affects the rate of its reaction with magnesium ribbon, name the independent variable, the dependent variable and two controlled variables. [4]
5. Plan an experiment to find which of two solid fuels releases more heat per gram when burned. [6]
6. When measuring the gas given off by a reaction, a student adds the solid to the acid and then fits the bung. Explain why the volume recorded is too low, and suggest an improvement. [2]
7. Why is a lid used on the polystyrene cup in a temperature-change experiment, and why polystyrene rather than glass? [2]
🔗Go deeper — other people’s work
These are external resources, not mine. If one stops working, tell me and everything above it on this page still stands.
- Cambridge International — the 0620 syllabus section on practical assessment, and the Paper 5 confidential instructions (ask your teacher)
- Royal Society of Chemistry — Practical Chemistry, method sheets for the standard experiments