Ecosystems and interactions
🎯What you need to be able to do
- Define ecosystem, habitat, population, community, niche, and biotic and abiotic factors.
- Construct and interpret food chains and food webs, using producer, consumer and trophic level.
- Explain why energy is lost between trophic levels and calculate transfer efficiency.
- Draw and interpret pyramids of numbers and biomass.
- Describe the carbon cycle and the water cycle.
- Describe interactions: competition, predation, mutualism and parasitism; and estimate populations with quadrats.
🌳Key words
- Ecosystem — a community of organisms and their non-living environment, interacting.
- Habitat — the place where an organism lives. Niche — its role in the ecosystem (what it eats, when it is active, where it lives).
- Population — all the organisms of one species in an area. Community — all the populations of different species in an area.
- Biotic factors — living: food, predators, disease, competitors. Abiotic factors — non-living: light, temperature, water, pH, soil minerals, salinity.
🐡Food chains and webs
A food chain shows how energy passes from one organism to the next; arrows point in the direction of energy flow (“is eaten by”). It always starts with a producer (a plant or alga that makes food by photosynthesis). Primary consumers (herbivores) eat producers; secondary and tertiary consumers eat other consumers. Each level is a trophic level. Decomposers (bacteria and fungi) break down dead organisms and waste. Real ecosystems contain many interlinked chains: a food web.
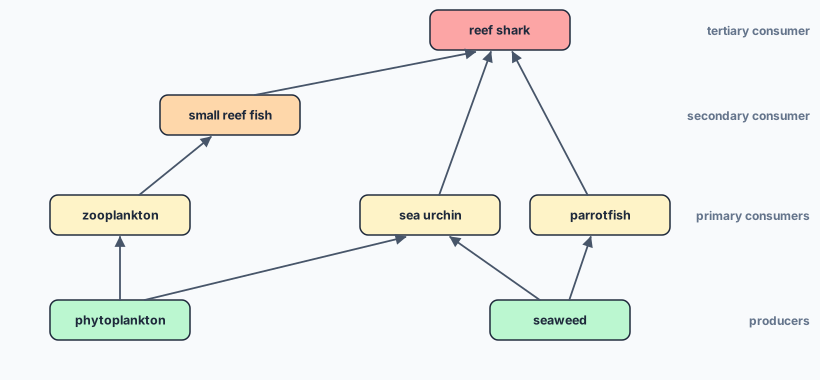
If one population changes, others in the web are affected. If sharks are overfished, the fish they eat may increase and overgraze; if parrotfish are overfished, seaweed can smother the coral.
⚡Energy flow
Only about 10% of the energy at one trophic level is passed on to the next. The rest is lost because:
- energy is used in respiration for movement, and much is lost as heat;
- not all of an organism is eaten (bones, roots, shells);
- not all of what is eaten is digested — some is lost in faeces and urine.
This is why food chains rarely have more than four or five levels, and why top predators are rare.
✏️Worked example: energy in a rice-field food chain
Rice → grasshoppers: 1800 ÷ 20 000 × 100 = 9.0%.
Grasshoppers → frogs: 150 ÷ 1800 × 100 = 8.3%.
Frogs → snakes: 12 ÷ 150 × 100 = 8.0%.
Why eat lower down: each step loses over 90% of the energy. Eating rice directly gives access to far more of the energy captured by the plants than eating animals that have already used most of it for their own respiration.
Ecological pyramids
A pyramid of numbers shows the number of organisms at each level; it can be an odd shape (one tree supports thousands of insects). A pyramid of biomass shows the dry mass at each level and is almost always a true pyramid, because biomass is lost at each step.
♻️Nutrient cycles
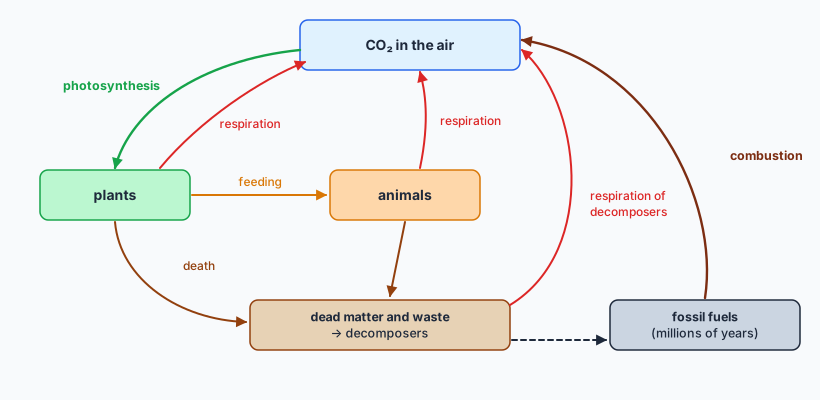
Carbon cycle: plants take in CO2 by photosynthesis and turn it into carbon compounds; carbon passes along food chains by feeding; respiration by all organisms returns CO2; decomposers respire as they break down dead matter; some carbon is locked up for millions of years in fossil fuels and limestone; combustion releases it. Burning fossil fuels and forests adds CO2 faster than photosynthesis removes it.
Water cycle: water evaporates from the sea and land and transpires from plants; the vapour rises, cools and condenses into clouds; it falls as precipitation; it runs off into rivers or soaks into the ground and returns to the sea. Forests matter because transpiration returns huge amounts of water to the air.
🤝Interactions and populations
- Competition — for limited resources (light, water, food, mates, territory), within or between species.
- Predation — predator and prey populations rise and fall in linked cycles.
- Mutualism — both species benefit: coral polyps and the algae living inside them (the algae photosynthesize and feed the coral; the coral gives shelter).
- Parasitism — one benefits and the host is harmed: ticks, tapeworms, the malaria parasite.
To estimate a plant population, place quadrats (square frames, e.g. 0.5 m × 0.5 m) at random positions, count the organisms in each, and scale up: population = mean number per quadrat × (total area ÷ quadrat area). A transect (a line with quadrats along it) shows how distribution changes, for example from the sea to the top of a beach.
🌎Science in context: the Coral Triangle
Indonesia lies at the heart of the Coral Triangle, home to more coral species than anywhere else. When sea temperatures rise, corals expel their symbiotic algae and turn white — coral bleaching. Without the algae the coral starves, and the whole reef food web, including the fish that coastal communities depend on, can collapse. Marine protected areas and reducing local pollution help reefs recover, but cannot stop warming on their own.
🧠Quick check
1. What is the difference between a population and a community?
A population is all the individuals of one species in an area; a community is all the populations of different species in that area.
2. Give two abiotic factors that affect plants on a rocky shore.
Any two: light, temperature, salinity, wave action, exposure to air at low tide, soil/substrate type.
3. Why do food chains rarely have more than five trophic levels?
About 90% of energy is lost at each level, so there is too little energy left to support another level of consumers.
4. Name the process that removes carbon dioxide from the air and three that return it.
Removed by photosynthesis; returned by respiration, decomposition (respiration of decomposers) and combustion.
5. Give an example of mutualism.
Coral and the algae living in its tissues; bees and flowering plants; nitrogen-fixing bacteria in legume roots.
6. A field is 1000 m2. Ten random 1 m2 quadrats contain a mean of 3.5 daisies. Estimate the population.
3.5 × 1000 = 3500 daisies.
📝Worksheet
Test yourself on the whole topic with a printable worksheet: questions for all four criteria, from recall to a design task, a data-analysis question and a short reflection, with a full mark scheme.
Worksheets are for members — sign in or join. The topic 1 worksheet is a free sample.