Speed, velocity and acceleration
🎯What you need to be able to do
- Distinguish distance from displacement, and speed from velocity (scalars and vectors).
- Use \( v = d/t \) and \( a = \Delta v / t \), with units.
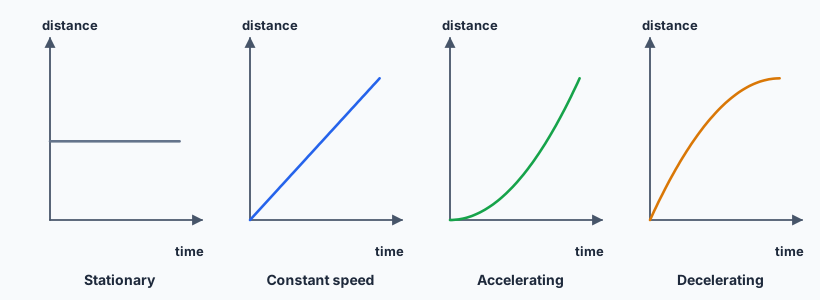
- Describe motion from the shape of a distance–time graph and find speed from its gradient.
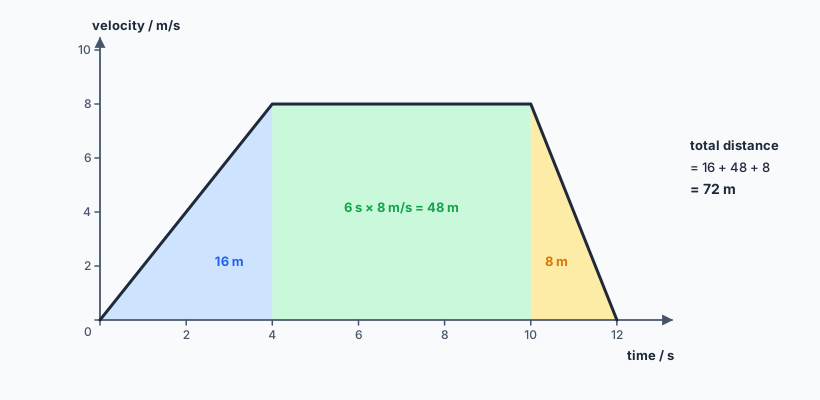
- Find acceleration from the gradient of a velocity–time graph and distance from the area under it.
- Explain how speed can be measured in the lab (light gates, ticker timers, video).
🧭Scalars and vectors
A scalar has size only; a vector has size and direction. This matters because the same trip can give very different numbers:
- Distance (scalar) — the total length of the path travelled.
- Displacement (vector) — the straight-line distance from start to finish, with a direction.
- Speed (scalar) — distance travelled per unit time.
- Velocity (vector) — displacement per unit time, i.e. speed in a stated direction.
A runner who completes one 400 m lap of a track has run a distance of 400 m but has a displacement of zero, because she finished where she started. Her average speed is not zero; her average velocity is. Other vectors you will meet are force, acceleration, weight and momentum; other scalars are mass, time, energy and temperature.
⏱️Speed
The SI unit is m/s; km/h is common in everyday life. To convert km/h to m/s, divide by 3.6 (because 1 km/h = 1000 m ÷ 3600 s). So 72 km/h = 20 m/s. Average speed is total distance over total time; instantaneous speed is the speed at one moment, which is what a speedometer shows.
In the lab you measure speed by timing a known distance. A stopwatch adds your reaction time (about 0.2 s) to every reading, so for short times use light gates connected to a data logger: the object breaks a beam at each gate and the logger records the time between them to a thousandth of a second.
🚀Acceleration
Acceleration is the rate of change of velocity. It is a vector: slowing down is acceleration in the opposite direction to the motion (often called deceleration, and given a negative sign).
An acceleration of 3 m/s2 means the velocity increases by 3 m/s every second. Near the Earth’s surface, a falling object with no air resistance accelerates at about 9.8 m/s2 — the acceleration due to gravity, \( g \).
📈Distance–time graphs
On a distance–time graph the gradient is the speed. A steeper line means a faster object.
📉Velocity–time graphs
A velocity–time graph carries two pieces of information:
- the gradient is the acceleration — a horizontal line means constant velocity (zero acceleration); a line sloping down means deceleration;
- the area under the line is the distance travelled (strictly, the displacement). Split the area into rectangles and triangles.
✏️Worked example: reading a velocity–time graph
(a) \( a = \dfrac{8 - 0}{4} = 2\ \text{m/s}^2 \).
(b) From 10 s to 12 s the velocity falls from 8 to 0: \( a = \dfrac{0 - 8}{2} = -4\ \text{m/s}^2 \), a deceleration of 4 m/s2.
(c) Area = triangle + rectangle + triangle \[ d = \tfrac{1}{2}(4)(8) + (6)(8) + \tfrac{1}{2}(2)(8) = 16 + 48 + 8 = 72\ \text{m} \]
(d) Average speed = total distance ÷ total time = 72 ÷ 12 = 6 m/s.
🪂Falling and terminal velocity
A skydiver who jumps from a plane speeds up at first because her weight is larger than the air resistance. As she speeds up, air resistance grows, until it equals her weight. The resultant force is then zero, so she stops accelerating and falls at a constant terminal velocity. On a velocity–time graph this appears as a curve that starts steep and levels off. Opening the parachute greatly increases air resistance, she decelerates, and a new, much lower terminal velocity is reached. (The forces are explained in Topic 3.)
🌎Science in context: speed cameras and stopping distances
Average-speed cameras time a car between two points kilometres apart, using exactly \( v = d/t \). Speed limits near schools exist because stopping distance rises steeply with speed: the thinking distance grows in proportion to speed, and the braking distance roughly with the square of the speed, so going from 30 to 60 km/h roughly quadruples the braking distance. This is a good Criterion D topic: the physics is clear, but setting a limit also involves journey times, enforcement, and whose safety is weighted most.
🧠Quick check
1. A cyclist rides 3.6 km in 12 minutes. Find her average speed in m/s.
\( v = 3600\ \text{m} \div 720\ \text{s} = 5.0 \) m/s.
2. A car goes from 5 m/s to 25 m/s in 8 s. Find its acceleration.
\( a = (25 - 5) \div 8 = 2.5 \) m/s2.
3. What does a horizontal line mean on (a) a distance–time graph and (b) a velocity–time graph?
(a) Stationary — the distance is not changing. (b) Constant velocity — the object is moving but not accelerating.
4. Why is displacement a vector but distance a scalar?
Displacement is measured in a straight line from start to finish in a stated direction; distance is only the length of the path, with no direction.
5. A train decelerates uniformly from 30 m/s to rest in 20 s. How far does it travel while braking?
Area of the triangle under the v–t graph: \( \tfrac{1}{2} \times 20 \times 30 = 300 \) m.
6. Convert 90 km/h to m/s.
\( 90 \div 3.6 = 25 \) m/s.
📝Worksheet
Test yourself on the whole topic with a printable worksheet: questions for all four criteria, from recall to a design task, a data-analysis question and a short reflection, with a full mark scheme.
Worksheets are for members — sign in or join. The topic 1 worksheet is a free sample.