Measurement and motion
🎯What you need to be able to do
- Use rulers, measuring cylinders, clocks and digital timers; find a small distance or a short time by measuring multiples.
- Tell scalars from vectors; find the resultant of two vectors at right angles EXTENDED.
- Use \( v = \dfrac{s}{t} \) and average speed; sketch, plot and interpret distance–time and speed–time graphs.
- Find speed from a gradient and distance from an area; use \( a = \dfrac{\Delta v}{\Delta t} \), deceleration and changing acceleration EXTENDED.
- State that \( g \approx 9.8 \) m/s2; describe falling with and without air resistance, and terminal velocity EXTENDED.
📚The physics
Measuring length, volume and time
A ruler measures length to the nearest millimetre. Read it with your eye directly above the mark to avoid parallax, and check where the object starts — it need not be at zero. A measuring cylinder measures the volume of a liquid: read the bottom of the meniscus with your eye level with it.
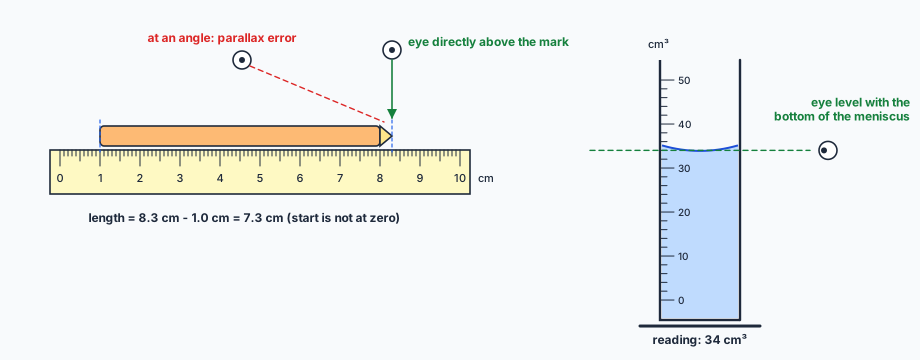
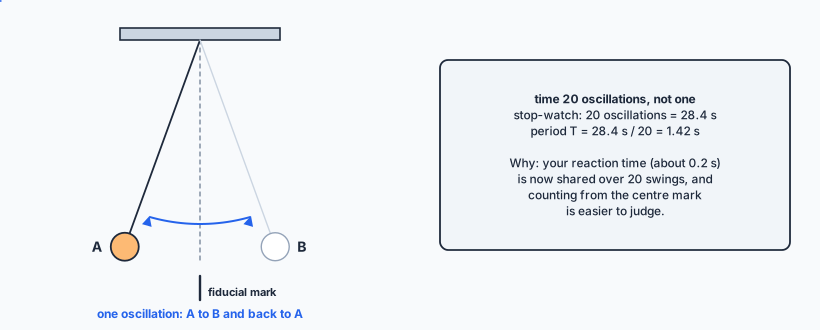
Time intervals are measured with a stop-watch or digital timer (light gates for very short times). Your reaction time is about 0.2 s, so short times and small distances are found by measuring multiples: time 20 swings of a pendulum and divide by 20; measure the thickness of 100 sheets of paper and divide by 100.
Scalars and vectors EXTENDED
A scalar has magnitude (size) only; a vector has magnitude and direction.
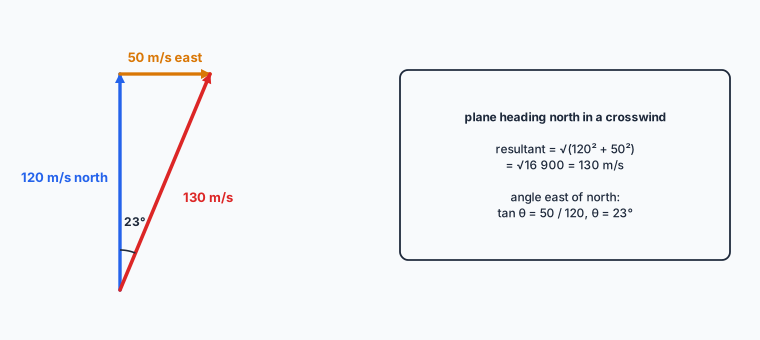
Two vectors at right angles combine to a resultant found by Pythagoras (or a scale drawing), with the direction from trigonometry.
Speed, velocity and acceleration
Speed is distance travelled per unit time; velocity is speed in a given direction. EXTENDED Acceleration is change in velocity per unit time, \( a = \dfrac{\Delta v}{\Delta t} \), in m/s2. A deceleration is a negative acceleration.
Motion graphs
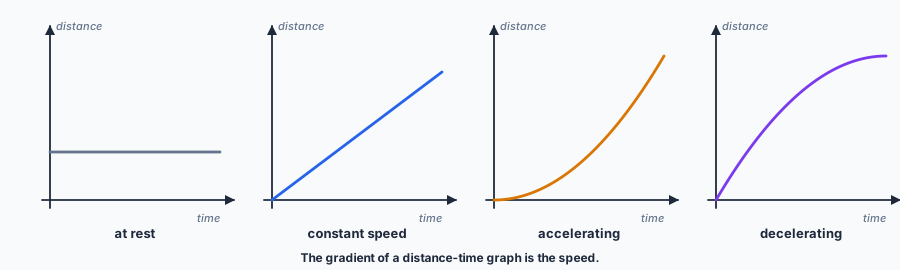
- Distance–time graph: gradient = speed. Horizontal = at rest; straight slope = constant speed.
- Speed–time graph: horizontal = constant speed; straight slope = constant acceleration; EXTENDED a curve means changing acceleration, and the gradient = acceleration.
- The area under a speed–time graph = distance travelled.
Falling objects
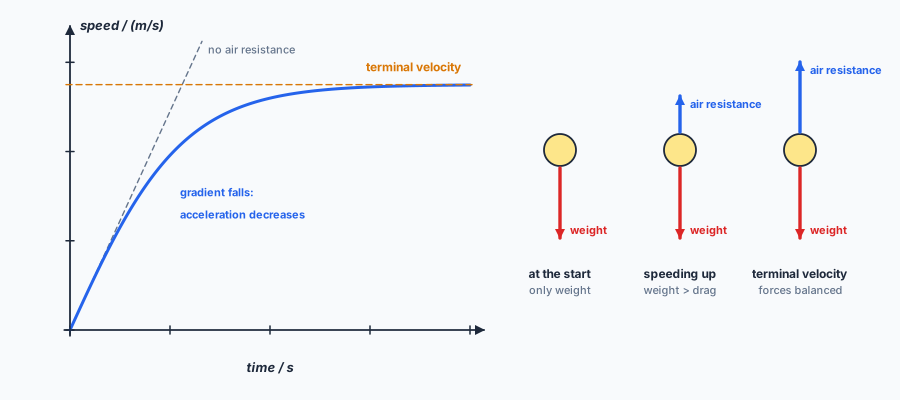
Near the Earth’s surface, the acceleration of free fall g is approximately constant, about 9.8 m/s2. EXTENDED Without air resistance, every object falls with this acceleration. With air resistance, the drag grows as the object speeds up, so the resultant force and the acceleration fall until drag equals weight: the object then falls at a constant terminal velocity.
✏️Worked example
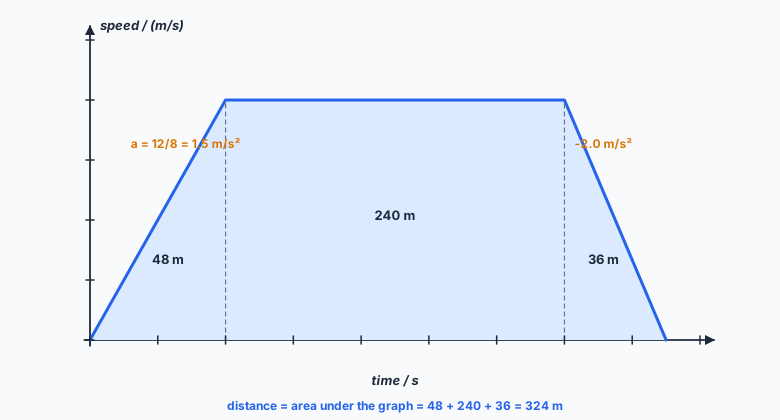
(a) 0–8 s: constant acceleration; 8–28 s: constant speed of 12 m/s; 28–34 s: constant deceleration.
(b) Area under the graph: \( \tfrac12 \times 8 \times 12 + 20 \times 12 + \tfrac12 \times 6 \times 12 = 48 + 240 + 36 = 324 \) m.
(c) \( a = \dfrac{12 - 0}{8} = 1.5 \) m/s2; at the end \( a = \dfrac{0 - 12}{6} = -2.0 \) m/s2, a deceleration of 2.0 m/s2.
(d) \( \dfrac{324}{34} = 9.5 \) m/s.
📝Practise
In the style of the multiple-choice, theory and practical papers. EXTENDED marks Supplement content.
1. (Multiple choice.) Which list contains only vector quantities? A: force, mass, velocity. B: momentum, weight, acceleration. C: speed, energy, weight. D: time, distance, temperature.
2. (Theory.) A runner completes 1500 m in 4.0 minutes. Calculate her average speed in m/s. [2] (Modelled on 0625/32 June 2026 Q1(b).)
3. (Practical.) Describe how to find the thickness of one sheet of paper using a 30 cm ruler. [2]
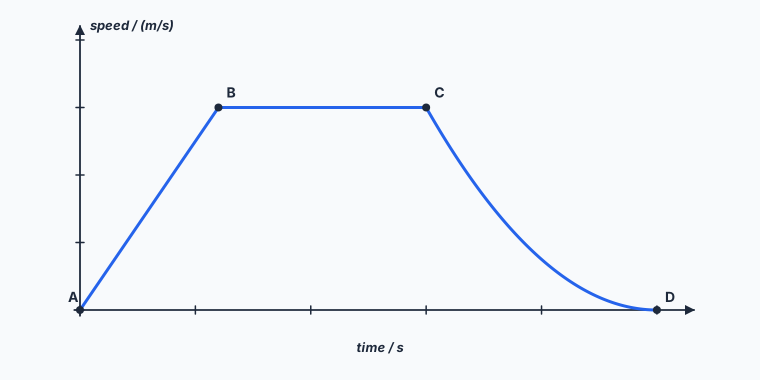
4. (Theory.) The graph shows a cyclist’s journey. State the motion between A and B, B and C, and C and D. [3] (Modelled on 0625/42 June 2026 Q1(a).)
5. (Theory.) Using the graph, calculate the distance travelled in the first 15 s, and EXTENDED the acceleration between A and B. [4]
6. (Theory.) EXTENDED A boat heads east at 4.0 m/s across a river flowing south at 3.0 m/s. Calculate the magnitude of its resultant velocity. [2]
7. (Theory.) EXTENDED A skydiver jumps from a plane. Explain, in terms of forces, why her speed increases at first but then becomes constant. [3]
8. (Theory.) EXTENDED A car travelling at 25 m/s brakes to rest in 5.0 s. Calculate its deceleration. [2]
🔗Go deeper — other people’s work
These are external resources, not mine. If one stops working, tell me and everything above it on this page still stands.
- PhET “The Moving Man” — position, velocity and acceleration graphs in real time
- The Physics Classroom — describing motion with graphs