Papers 5 and 6: experiments and planning
🎯What you need to be able to do
- Carry out (Paper 5) or describe and analyse (Paper 6) the standard experimental contexts in the syllabus.
- Turn a relationship into a straight-line graph and use its gradient and intercept.
- Plan an investigation: choose the variable, apparatus, method, controls, table and analysis.
- Identify hazards and suggest precautions; suggest specific improvements.
📚The contexts
The syllabus lists the contexts you should expect: measuring lengths, volumes, forces, short times and small distances; derived quantities such as extension per unit load, resistance or acceleration; testing the relationship between two variables; comparing angles of reflection or densities; heating and cooling; springs and balances; timing motion or oscillations; electric circuits (connecting them and measuring current and p.d.); optics with pins, mirrors, prisms, lenses and glass blocks; and unfamiliar procedures with simple apparatus. The skills page covers readings, tables and graphs; this page covers the experiments.
Timing oscillations: the pendulum
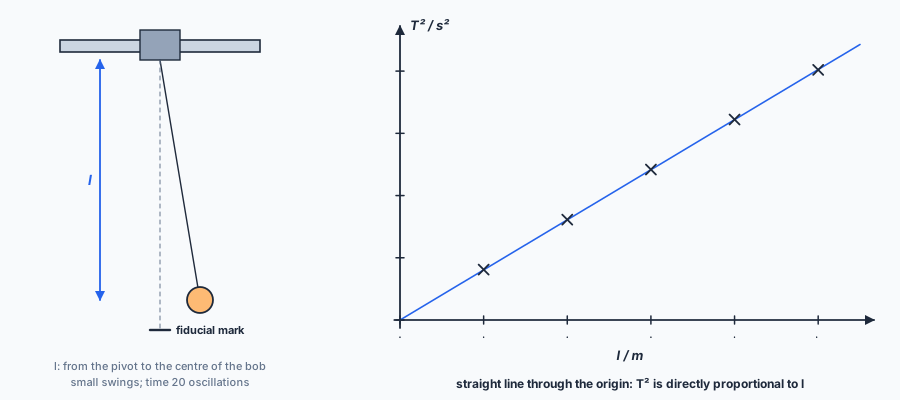
- Measure l from the pivot to the centre of the bob; keep the swings small (about 10°).
- Time 20 oscillations, starting and stopping as the bob passes the fiducial mark; repeat and average; T = t / 20.
- Why: reaction time (~0.2 s) is a large fraction of one period (~1 s) but a small fraction of 20.
Straight-line graphs from circuits
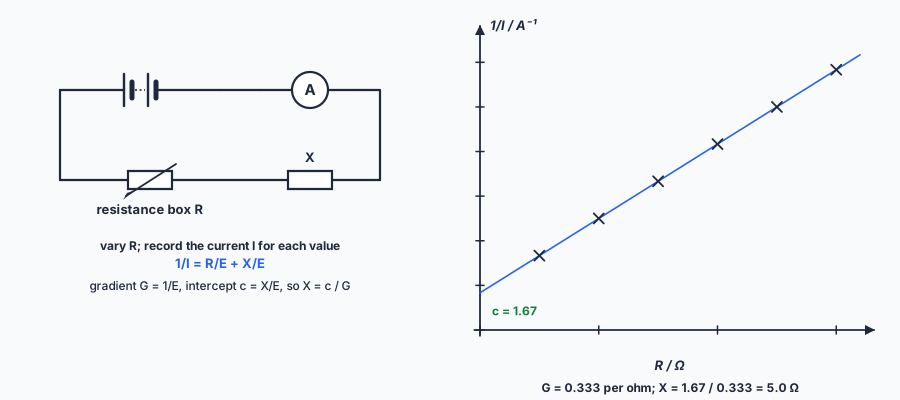
Paper 5 and Paper 6 often give an equation and ask you to plot an unfamiliar combination (1/V, 1/I, T2…) against a variable. Write the equation in the form y = mx + c, identify what the gradient and intercept represent, then read them from your line. Connect ammeters in series and voltmeters in parallel; open the switch between readings so wires do not heat up (their resistance would change).
Optics: pins and a mirror or block
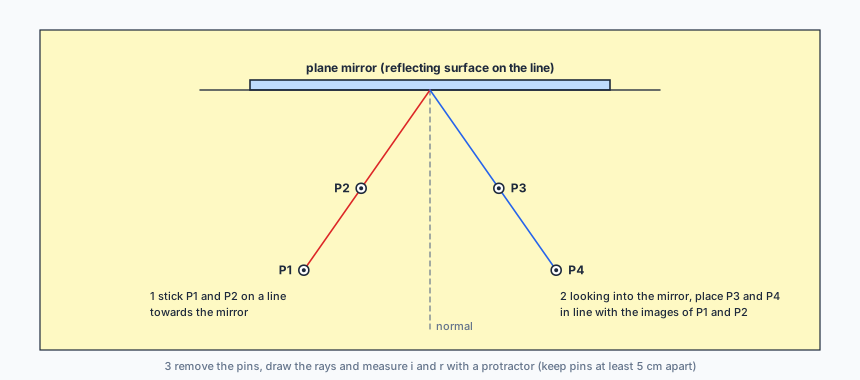
The same method traces a ray through a rectangular or semicircular glass block, or a prism: mark the outline, place two pins on the incident ray, sight two more through the block, and join up. A converging lens’s focal length can be estimated by focusing a distant window on a screen.
Heating and cooling
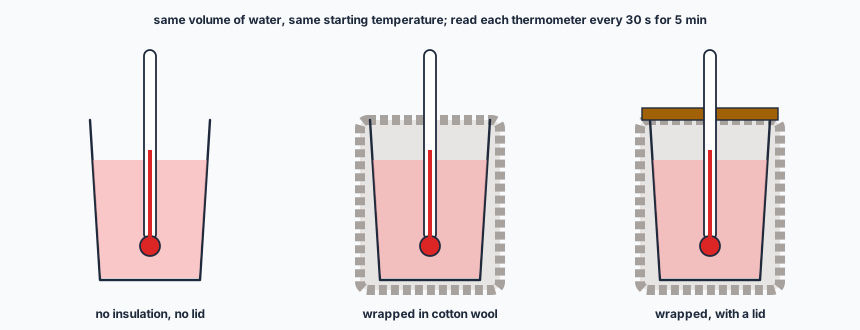
- Control: the volume of water, the starting temperature, the room (draughts), the cup type, the time between readings.
- Compare the temperature fall in the same time or plot cooling curves on the same axes.
- Hazard: hot water can scald — stand to pour, keep cups away from the bench edge, wipe up spills.
Other contexts to know
📝The planning question
The last question usually asks you to plan an experiment you do not carry out. Marks go to these points — use them as headings:
- Variable: state the one independent variable you will change (in words, not just implied by the method).
- Apparatus: name what you need in addition to what is given — always a way to measure the dependent variable (e.g. a stop-watch) and the independent variable.
- Method: what you do and what you measure, and that you repeat for a new value of the variable.
- Control variables: name at least one (two for full marks) that could affect the result.
- Table: columns for the independent and dependent variables, each headed quantity / unit.
- Conclusion: how you will use the readings — plot a graph of y against x, or compare values to see whether and how y changes.
- Extra: at least five values; repeat each measurement and average.
✏️Worked example
Variable: the height of the top of the ramp (the angle of the slope).
Extra apparatus: a stop-watch; blocks to raise the ramp (the metre rule measures the height).
Method: set the ramp height, measure it with the metre rule; release the marble from rest at the same starting line each time; measure the time t between the two marks; repeat three times and average; change the height and repeat for at least five heights (e.g. 5, 10, 15, 20, 25 cm).
Controls: the same marble (mass and size); the same distance between the marks; the same starting point; the same ramp surface.
Table: height h / cm | t1 / s | t2 / s | t3 / s | mean t / s.
Conclusion: plot a graph of mean t against h and describe how t changes as h increases.
📝Practise
In the style of Paper 5 and Paper 6.
1. (Practical.) A student measures the density of a cube of modelling clay by (1) measuring its sides and its mass, and (2) displacement in a measuring cylinder. State one technique that improves each method. [2] (Modelled on 0625/52 and 0625/62 June 2026 Q1.)
2. (Practical.) In the circuit above, a student plots 1/I against R and finds a gradient of 0.25 A−1 per Ω and an intercept of 2.0 A−1. Calculate the resistance X and the e.m.f. E. [3] (Modelled on 0625/52 and 0625/62 June 2026 Q3.)
3. (Practical.) Explain why the switch should be opened between readings in an electrical experiment. [1]
4. (Practical.) A student times 1 oscillation of a pendulum as 1.3 s. Suggest two improvements. [2]
5. (Practical.) Plan an experiment to investigate how the length of a constantan wire affects its resistance. Include the apparatus, method, a control variable and how you would present the results. [6]
6. (Practical.) Why are optics pins placed at least 5 cm apart when marking a ray? [1]
🔗Go deeper — other people’s work
These are external resources, not mine. If one stops working, tell me and everything above it on this page still stands.
- Institute of Physics — practical physics experiment guides
- Cambridge International — the 0625 syllabus list of apparatus for the practical papers