Papers 5 and 6: skills and marks
🎯What you need to be able to do
- Take readings from analogue and digital instruments (or from diagrams of them) to the right precision, correcting zero errors.
- Record results in a table with quantity / unit headings and consistent precision; give calculated values to sensible significant figures, with units.
- Draw graphs with labelled axes, sensible scales, accurate plots and a thin best-fit line; find gradients and intercepts.
- Decide whether two results are equal within experimental accuracy (the 10% rule), write justified conclusions, and evaluate methods.
📄The two papers
Everyone takes one of them; both are worth 20%, test AO3 only and cover the full grade range, so Core and Extended candidates sit the same paper. They test the same skills in the same contexts — in June 2026 both papers were built on the same four experiments (a density measured two ways, the heating of black and white surfaces, a circuit analysed with a straight-line graph, and a plan for a timing experiment). In Paper 6, “take a reading” means reading a picture of a meter, a thermometer or a ruler, so practise with the diagrams below. The next page covers the experiments and the planning question.
1. Readings and precision
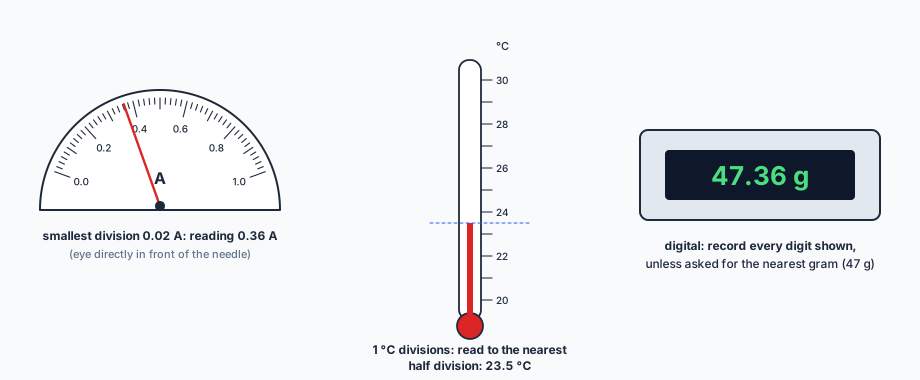
- Analogue scales: work out the value of one division first; read to the nearest half division, with your eye directly in front of the pointer or level with the meniscus.
- Digital displays: record all the digits, unless the question says “to the nearest gram” — then 16.42 g is recorded as 16 g, and 16.0 is marked wrong.
- Rulers: to the nearest millimetre, which in cm means one decimal place (5.2 cm, not 5.20 or 5).
- Zero errors: if a meter or balance does not read zero with nothing connected, subtract that reading from every measurement.
- Timing: time many oscillations (e.g. 20) and divide; start and stop at a fixed marker.
2. Tables, significant figures and units
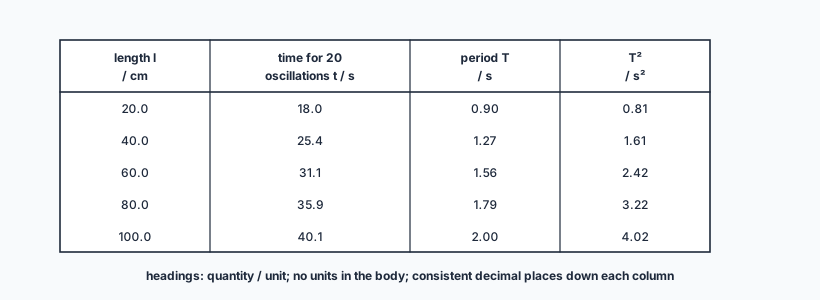
- Headings are quantity / unit (length / cm), never units in the body of the table.
- Give calculated values to 2 or 3 significant figures, or to the number asked for; “give your answer to 2 significant figures” carries its own mark.
- Units are marked: a rate of temperature rise is °C/min (not C°/min, and not “mins”).
3. Graphs
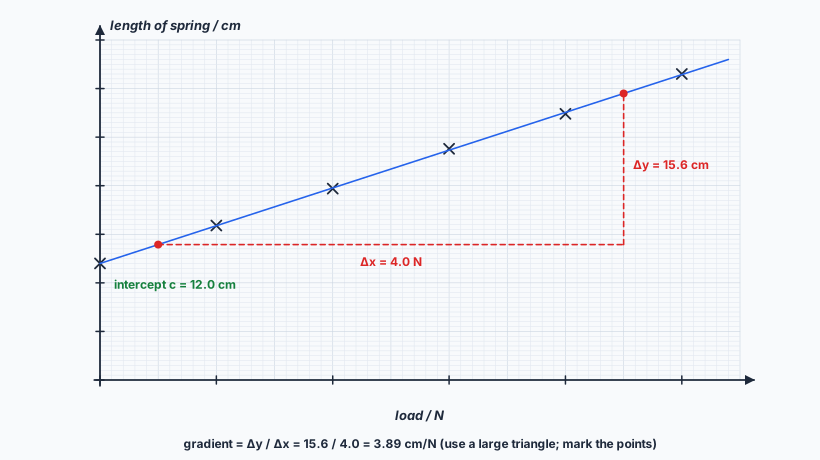
- Axes the right way round (the question says which goes on y), each labelled quantity / unit.
- Scales: simple steps (1, 2 or 5 units per 2 cm), using more than half of the grid in each direction. Awkward scales (3, 7, 9 per square) lose the mark. Start at the origin only if told to.
- Plots to within half a small square, as small crosses or dots in circles — no large blobs.
- Best-fit line: one thin, continuous straight line (or smooth curve) with points evenly scattered on both sides; ignore a clear anomaly.
- Gradient: use a triangle covering at least half of the line, mark the two points, and show Δy / Δx with the values read off.
- Intercept: extend the line to the y-axis and read it to half a small square.
4. The 10% rule, conclusions and evaluation
Cambridge treats two values as equal within the limits of experimental accuracy if they are within 10% of each other. Always back the statement with a calculation: the difference as a percentage, or the ratio of the smaller to the larger (≥ 0.90 means equal).
- Conclusions must quote your own values: “the black card’s temperature rose faster: 3.4 °C/min against 1.9 °C/min”.
- Fair tests: name the variable that was not controlled (e.g. the two cards were at different distances from the lamp).
- Sources of error and improvements must be specific to the experiment: “it was hard to judge when the water levels were equal — view both surfaces at eye level and add the last water with a pipette”. “Human error” or “be more careful” scores nothing.
- Repeat readings and take a mean, and take at least five sets of readings over a wide range.
✏️Worked example
(a) Yes. Difference = 1.74 − 1.62 = 0.12; 0.12 / 1.74 × 100 = 6.9%, which is less than 10% (or the ratio 1.62 / 1.74 = 0.93 ≥ 0.90).
(b) The rise in water level is small compared with the scale divisions, so it is hard to read precisely — use a narrower measuring cylinder with smaller divisions (or a larger piece of clay); read the bottom of the meniscus at eye level.
(c) It should be recorded to the nearest millimetre, e.g. 3.0 cm: a ruler reads to 0.1 cm.
📝Practise
In the style of Paper 5 and Paper 6.
1. (Practical.) A thermometer has 1 °C divisions. The mercury is exactly halfway between 31 and 32. How should the temperature be recorded? [1]
2. (Practical.) A student compares the rates of cooling of a black can and a shiny can of hot water. The black can cools from 70.0 °C to 55.0 °C in 5.0 min; the shiny can from 80.0 °C to 70.5 °C. Calculate each rate of cooling to 2 significant figures, with the unit, and write a conclusion. [4] (Modelled on 0625/52 and 0625/62 June 2026 Q2.)
3. (Practical.) The comparison in question 2 was not fair. Suggest why, and explain why the conclusion would still be the same if it were fair. [2]
4. (Practical.) State two ways in which a graph can lose marks for its scales. [2]
5. (Practical.) A voltmeter reads 0.1 V when it is not connected to anything. The student then measures a p.d. of 2.7 V. What is the true p.d.? [1]
6. (Practical.) Two values of the period of a pendulum are 1.42 s and 1.60 s. Are they equal within the limits of experimental accuracy? [2]
🔗Go deeper — other people’s work
These are external resources, not mine. If one stops working, tell me and everything above it on this page still stands.
- Cambridge International — the 0625 syllabus section “Practical assessment” and its guidance on tables and graphs
- Institute of Physics — practical physics guidance for measurement and uncertainty