Exploring and designing
🎯What you need to be able to do
- Turn a curiosity into a research question that can actually be answered by measurement.
- State a hypothesis or prediction, and give the physics reason behind it.
- Describe the three kinds of investigation: laboratory, database, and simulation or model.
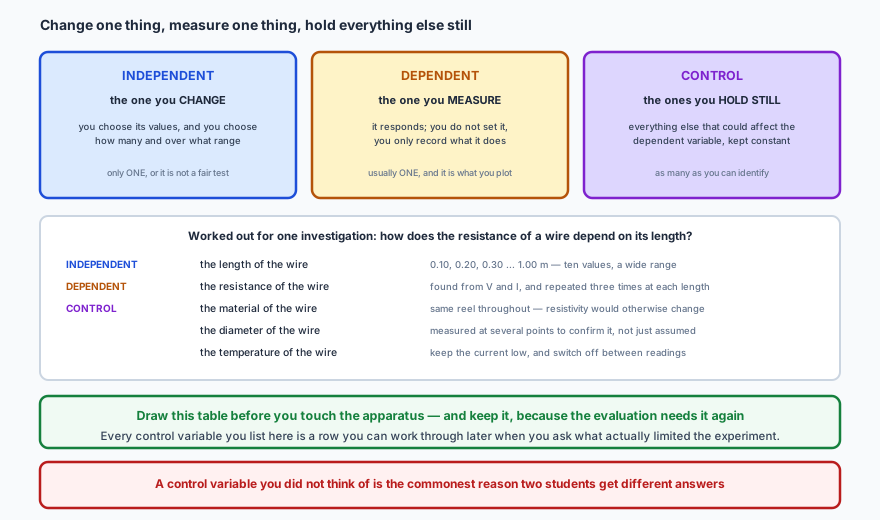
- Identify the independent, dependent and control variables for an investigation.
- Choose a sensible range and number of values, and justify how many repeats you will take.
- Explain the value of a pilot run.
- Explain what calibration means and when an instrument needs it.
- Describe how to reduce known problems in thermal, kinematics, circuit and radioactivity experiments.
🔍From curiosity to a question you can answer
Everything starts with noticing something. The job of this stage is to sharpen that into a research question narrow enough that measurement can settle it — which in practice means it must name what you will change, what you will measure, and over roughly what range.
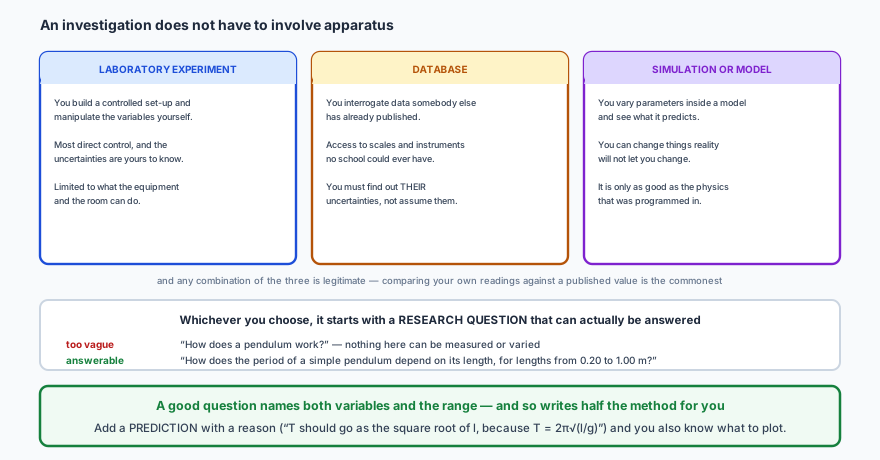
A hypothesis is a proposed explanation; a prediction is what that explanation says will happen. The prediction is the more useful of the two here, because it can be wrong in a way you would notice. “The period will increase with length” is a prediction. “The period will go as \( \sqrt{l} \), because \( T = 2\pi\sqrt{l/g} \)” is a better one — it is more specific, it carries its reason with it, and it tells you to plot \( T^{2} \) against \(l\).
✏️Worked example 1 — sharpening a question
What could be changed? The angle to the light, the distance from the lamp, the colour of the light, the area illuminated, the temperature of the panel. Pick one — say the distance.
What could be measured? The output potential difference, the short-circuit current, or the power delivered to a fixed load. Power is the most physically meaningful, so use it.
Over what range? Close enough that the panel is well lit, far enough that the power has fallen substantially — a pilot run will settle it, but 0.10 m to 1.00 m is a sensible first guess.
📋The three kinds of variable
An experiment is a fair test only if one thing changes at a time. That gives three categories, and writing them out explicitly before you start is the single most useful habit in this whole topic.
📏Designing the method
Three decisions do most of the work: how far the independent variable will range, how many values you will take within that range, and how many times you will repeat each one.
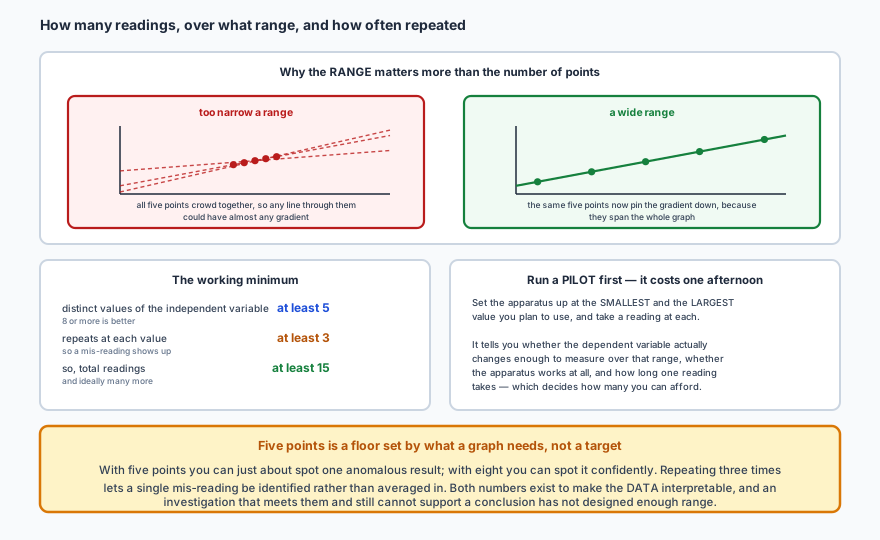
A pilot run costs one afternoon and routinely saves several. Set the apparatus up at the extremes of your intended range and take one reading at each. It answers three questions at once: does the dependent variable change enough over that range to be worth measuring, does the apparatus work at all, and how long does one reading take — which is what decides how many you can realistically collect.
🔧Controlling what you cannot eliminate
Some problems are inherent to the apparatus rather than to your technique. Each of the four below has a standard fix, and each fix is a design decision — made before any real data exists, so that the problem never has to be apologised for later.
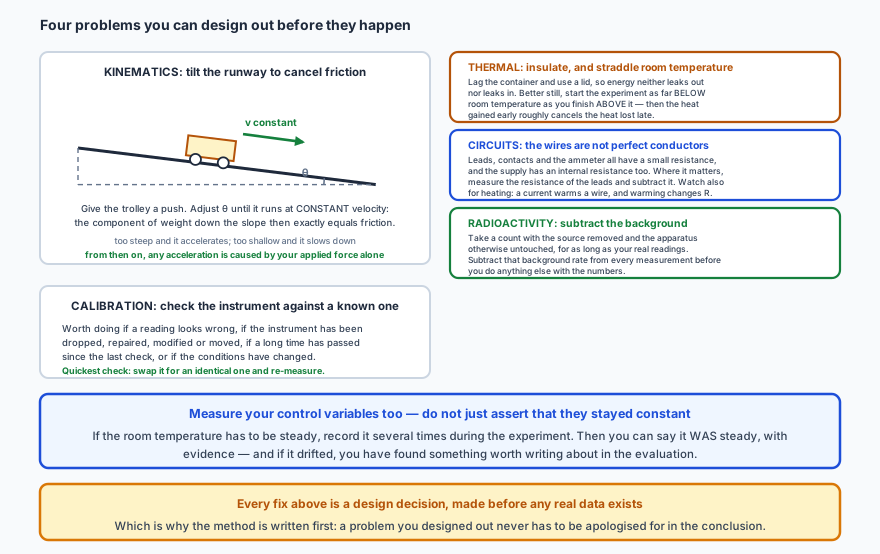
Calibration means checking an instrument against one whose reading is trusted. It is worth doing when a reading looks wrong, when the instrument has been dropped, repaired, modified or moved, when a long time has passed since the last check, or when conditions have changed. The quickest version in a school laboratory is simply to swap the instrument for an identical one and re-measure — if the two disagree, at least one of them needs attention.
✏️Worked example 2 — designing an investigation end to end
Variables.
Why that range. Ten values across a factor of ten in length: wide enough that the resistance changes by a factor of ten too, so the gradient is well determined. A pilot at 0.10 m and 1.00 m confirms that both ends give a measurable current at the supply voltage available.
Two problems designed out.
Heating. A current warms the wire and warming changes its resistance, which would make the resistance depend on how long the current has been flowing rather than only on length. Fix: use the smallest current that still gives a readable meter deflection, and switch off between readings.
Lead and contact resistance. The leads and the crocodile clips have a resistance of their own, which adds to every reading equally — a systematic error. Fix: measure the resistance with the clips touching (zero length of wire) and subtract that from every result.
📝Practise
Work through these, then reveal the answer. Each question targets a different objective from the list above.
1. Explain why “How does temperature affect a resistor?” is not yet a usable research question, and rewrite it.
A usable version: “How does the resistance of a thermistor depend on its temperature, between 20 °C and 80 °C?” That names the independent variable (temperature), the dependent variable (resistance) and the range, and so already implies the apparatus and the method.
2. Distinguish a hypothesis from a prediction, and give an example of each for a pendulum investigation.
Hypothesis: the period of a pendulum is set by the restoring force from gravity acting on the bob, and so should depend on the length of the string but not on the mass.
Prediction: a graph of \( T^{2} \) against \(l\) will be a straight line through the origin with gradient \( 4\pi^{2}/g \), and changing the mass of the bob will not change \(T\).
The prediction is the more useful, because it says exactly what to plot and what would count as disagreement.
3. For an investigation into how the current through a filament lamp depends on the potential difference across it, identify the independent, dependent and at least two control variables.
Dependent: the current through the lamp, read from an ammeter in series.
Control: the lamp itself — the same one throughout, since filaments differ; the ambient temperature and airflow, since cooling affects the filament's temperature and therefore its resistance; and the time the lamp is left on at each setting, since it takes a moment to reach a steady temperature.
That last one is easy to miss and matters here: this experiment is really about a resistance that changes with temperature, so anything affecting temperature is a control variable.
4. A student takes five readings, all between 4.0 cm and 4.4 cm of extension. Explain what is wrong with this design and what it does to the conclusion.
It also makes it impossible to tell whether the relationship is linear: over a short enough stretch, almost any smooth curve looks straight. The conclusion would therefore be unable to support either a value for the spring constant or a claim that Hooke's law holds.
The fix is to extend the range as far as the apparatus safely allows — here, up to just below the elastic limit — rather than to add more points inside the same narrow band.
5. State three things a pilot run tells you, and explain why each changes the design.
Whether the apparatus works as expected. Meters that will not read, a supply that cannot deliver enough current, a timer that will not trigger — all far cheaper to find at the start.
How long a single reading takes. That sets how many values and repeats are realistic. If one reading takes ten minutes, ten values with three repeats each is five hours of work, and the design has to be scaled to fit the time available.
6. Explain how tilting a runway lets you investigate the effect of a force on a trolley without friction spoiling the result.
At that angle, the component of the trolley's weight acting down the slope is exactly equal in magnitude to the frictional force opposing its motion, so the resultant force on the moving trolley is zero. Friction has not been removed; it has been precisely cancelled.
From then on, any acceleration you measure must be caused by whatever additional force you apply, which is what the experiment set out to investigate. If the trolley speeds up on its own the slope is too steep; if it slows down, too shallow.
7. In a thermal experiment, explain the advantage of starting as far below room temperature as you finish above it.
By arranging the experiment to start as far below room temperature as it finishes above, the energy gained during the first half roughly cancels the energy lost during the second, so the two errors largely offset instead of accumulating.
It is a partial fix rather than a perfect one — the rate of transfer depends on the temperature difference and on how long each phase lasts — and it is used alongside insulation and a lid, not instead of them.
8. State when an instrument should be calibrated, and describe the quickest practical check available in a school laboratory.
The quickest practical check is to compare it against a second, identical instrument measuring the same thing, or against a known standard — a thermometer in melting ice should read 0 °C, a balance with a standard mass should read that mass, an ammeter in series with another ammeter should agree with it. Any disagreement tells you at least one of them needs attention, even if it does not immediately tell you which.
9. Explain why the resistance of the leads is a systematic error in a wire-resistance experiment, and how the design can remove it.
The fix is to measure it: connect the crocodile clips directly together, so the length of wire between them is zero, and record the resistance. That is the lead resistance, and subtracting it from every reading corrects the whole data set.
Equivalently, plot \(R\) against \(l\) and use the gradient rather than individual values — a constant offset shifts the intercept but leaves the gradient untouched, which is one of the reasons graphs are preferred to single readings.
10. A student proposes measuring background radiation once, at the start of a two-hour experiment. Explain why a longer background count is better, and where in the analysis it is used.
It is used at the very start of the analysis: the background rate is subtracted from every measured count rate before anything else is done with the numbers — before halving for half-lives, before plotting, before taking logs. Subtracting it later, or forgetting it, biases every result upward by the same amount, and it is a systematic error that no amount of repetition will reveal.
🔗Go deeper — other people’s work
These are external resources, not mine. If one stops working, tell me and everything above it on this page still stands.
- The IB Physics guide internal assessment criteria — what the design work is actually marked against
- Royal Society of Chemistry — risk assessment guidance, which transfers directly to physics practicals