Home › Learning Hub › IB DP Physics › E.3 Radioactive decay
E.3

Radioactive decay

Theme E · Nuclear and quantum physics · SL and HL, with additional HL material marked

Radioactive decay is the one part of physics where the individual event is genuinely unpredictable and the bulk behaviour is exactly predictable. Getting comfortable with both halves of that sentence is most of this topic.

🎯What you need to be able to do

  • Use nuclide notation, and say what makes two nuclides isotopes of one element.
  • Work in unified atomic mass units and in MeV c−2, and convert between mass and energy.
  • Calculate mass defect and binding energy, and the binding energy per nucleon.
  • Read the binding-energy-per-nucleon curve, and use it to explain why both fission and fusion release energy.
  • Describe the strong nuclear force, and explain why large nuclei become unstable.
  • Describe alpha, beta and gamma radiation, compare their properties, and write balanced decay equations.
  • Explain what the continuous beta spectrum showed, and what the neutrino was invented to fix.
  • Use half-life and activity, and subtract background before using any measurement.
  • HLExplain the N–Z stability curve and what discrete gamma energies show about the nucleus.
  • HLUse \( N = N_0e^{-\lambda t} \) and \( A = \lambda N \), and find a half-life from a log-linear graph.

🔢Nuclides, isotopes, and the notation for both

A nuclide is one particular species of nucleus — a definite number of protons and a definite number of neutrons. It is written with both numbers attached to the chemical symbol:

\[ ^{A}_{Z}\text{X} \]

\(Z\) is the proton number, and it alone fixes which element you have. \(A\) is the nucleon number, protons plus neutrons together. The neutron number is whatever is left over, \( N = A - Z \), and it is worth writing that down as a formula because questions ask for it constantly.

Isotopes are nuclides of the same element — same \(Z\), different \(A\). Carbon-12, carbon-13 and carbon-14 all have six protons, so all three are carbon and all three behave identically in every chemical reaction. What differs is the number of neutrons, and therefore the stability of the nucleus. Two of those three are stable forever; the third has a half-life of 5730 years.
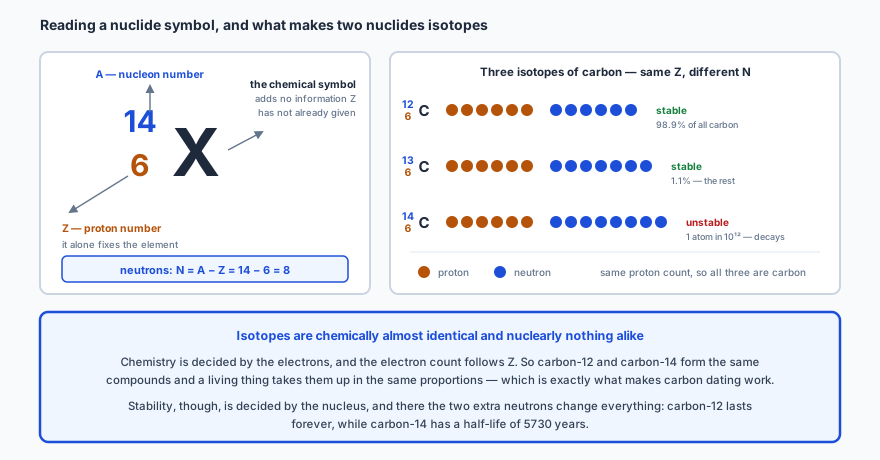
On the left, a large chemical symbol X with 14 written at the upper left labelled the nucleon number A and 6 at the lower left labelled the proton number Z, which alone fixes the element; a note says the chemical symbol adds no information that Z has not already given, and a boxed line gives the neutron count as N equals A minus Z equals 14 minus 6 equals 8. On the right, the three isotopes of carbon drawn as rows of coloured circles: carbon-12 with six protons and six neutrons, marked stable and 98.9 per cent of all carbon; carbon-13 with six protons and seven neutrons, marked stable and the remaining 1.1 per cent; and carbon-14 with six protons and eight neutrons, marked unstable, about one atom in a million million. A legend identifies protons and neutrons and notes that the proton count never changes, so all three are carbon.
The chemistry follows the electrons, and the electron count follows \(Z\) — which is exactly why a living thing takes up carbon-14 in the same proportion as the atmosphere offers it, and therefore why carbon dating works at all.

⚖️A mass unit that suits the nucleus

Kilograms are hopeless here. A proton is about \( 1.67 \times 10^{-27} \) kg, and the differences that matter in this topic are four decimal places into that number. So nuclear masses are quoted in unified atomic mass units, defined so that one atom of carbon-12 has a mass of exactly 12 u.

1 u\( 1.661 \times 10^{-27} \) kg
proton1.007276 u
neutron1.008665 u
electron0.000549 u

Because mass and energy are the same thing in different units (A.5), a mass can be quoted directly as an energy. Putting \( 1\,\text{u} \) through \( E = mc^2 \) gives

\[ 1\,\text{u} = 931.5\ \text{MeV}\,c^{-2} \]

and that single conversion factor does almost all the work in this topic. Read it as: a mass of one unified mass unit is an energy of 931.5 MeV. The \( c^{-2} \) is there so the units say “mass”; in practice you multiply a mass in u by 931.5 and read off an energy in MeV.

📏Mass defect and binding energy

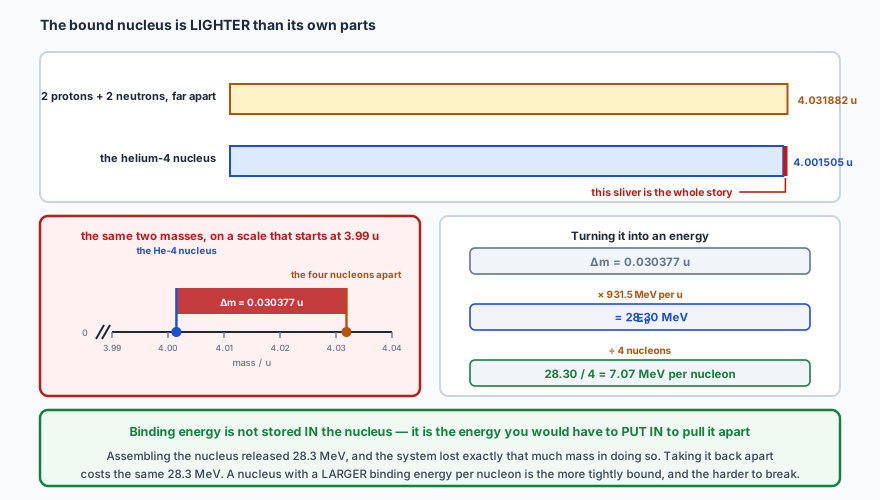
Here is the fact the whole topic rests on. Take the four particles that make up a helium-4 nucleus — two protons and two neutrons — weigh them separately, and add up the masses. Then weigh the assembled nucleus. The nucleus is lighter.

the parts\( 2(1.007276) + 2(1.008665) = 4.031882 \) u
the nucleus4.001505 u
the difference0.030377 u

That difference is the mass defect, \( \Delta m \). It is not a measurement error and it is not small change: it is the mass that was released as energy when the nucleus formed. The energy equivalent of the mass defect is the binding energy \( E_b \) — the energy you would have to supply to pull the nucleus completely apart into free nucleons.
\[ E_b = \Delta m\,c^2 \]
At the top, two horizontal bars drawn to the same scale: the upper bar, two protons plus two neutrons far apart, has length 4.031882 unified mass units; the lower bar, the helium-4 nucleus, has length 4.001505 units. The tiny difference at the right-hand end is picked out in red and labelled as the whole story. Below left, the same two masses replotted on a scale that begins at 3.99 units, with a break symbol at the axis origin: the two masses now sit clearly apart, with the gap between them shaded and labelled delta m equals 0.030377 units. Below right, a chain of three boxes converting that mass into an energy: delta m equals 0.030377 units, multiplied by 931.5 MeV per unit gives a binding energy of 28.30 MeV, divided by four nucleons gives 7.07 MeV per nucleon.
The mass defect is 0.75% of the total — invisible on a bar drawn to scale, and yet it is the entire binding of the nucleus. Chemical bonds have a mass defect too; it is simply a million times smaller, and nobody can weigh it.

✏️Worked example 1 — binding energy of helium-4

The mass of a helium-4 nucleus is 4.001505 u. Taking the proton mass as 1.007276 u and the neutron mass as 1.008665 u, find the binding energy of the nucleus in MeV, and the binding energy per nucleon.

Add up the separate parts. Helium-4 has \( Z = 2 \) and \( N = A - Z = 2 \), so it is two protons and two neutrons:

\[ 2(1.007276) + 2(1.008665) = 4.031882\ \text{u} \]

Take the mass defect. Parts minus whole:

\[ \Delta m = 4.031882 - 4.001505 = 0.030377\ \text{u} \]

Convert to an energy. Multiply by 931.5 MeV per u:

\[ E_b = 0.030377 \times 931.5 = 28.30\ \text{MeV} \]

Divide by the number of nucleons. There are four of them, so

\[ \frac{E_b}{A} = \frac{28.30}{4} = 7.07\ \text{MeV per nucleon} \]
Sanity check. Every nucleus heavier than about lithium sits between 7 and 9 MeV per nucleon — that is the whole vertical range of the curve in the next section. 7.07 lands inside it, and on the low side, which is right for a nucleus this light. An answer of 28 MeV per nucleon would be four times too big, and is the single most common way to lose this mark.
The trap: binding energy and binding energy per nucleon are different quantities. Uranium-238 has a total binding energy of about 1800 MeV, far more than iron-56’s 490 MeV — and uranium is nevertheless the less tightly bound of the two, because what measures tightness is the energy per nucleon: 7.57 against 8.79. Total binding energy grows with size almost automatically, so it says very little. If a question asks which nucleus is more stable, it wants the per-nucleon figure every time.

📈The curve that explains both fission and fusion

Plot binding energy per nucleon against nucleon number for every nuclide, and one shape emerges: a steep climb through the light elements, a broad maximum around iron, and a slow decline all the way to uranium. The peak is at iron-56, at 8.79 MeV per nucleon, which is therefore the most tightly bound nucleus there is.
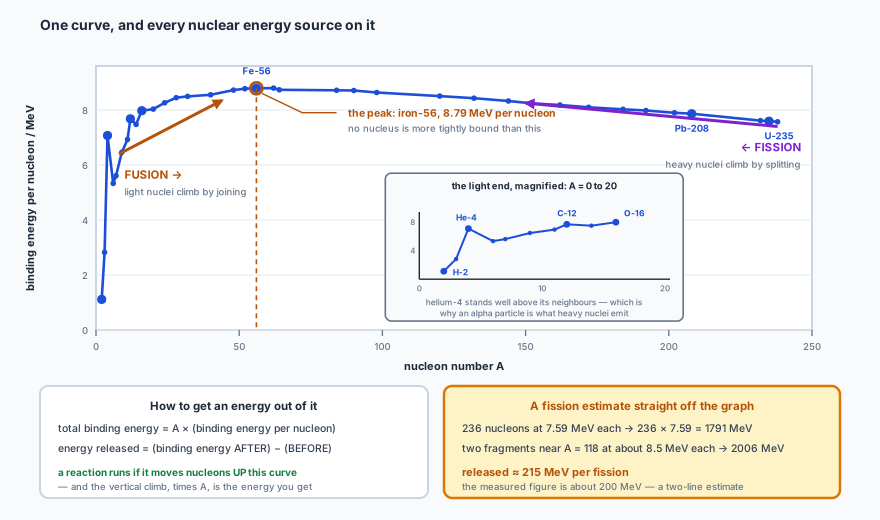
A graph of binding energy per nucleon in MeV against nucleon number A from 0 to 250. The curve rises very steeply from hydrogen-2 at about 1.1 MeV, reaches a broad maximum at iron-56 at 8.79 MeV, which is ringed and marked as the peak, then declines slowly through lead-208 at 7.87 to uranium-235 at 7.59. An amber arrow on the left half points up and to the right, labelled fusion, light nuclei climb by joining; a purple arrow on the right half points up and to the left, labelled fission, heavy nuclei climb by splitting. An inset magnifies the light end from A equals 0 to 20, showing that the rise is a staircase rather than a smooth line and that helium-4 stands well above its neighbours. Two boxes below give the method: total binding energy equals A times binding energy per nucleon, energy released equals binding energy after minus before; and a worked estimate in which 236 nucleons at 7.59 MeV become two fragments near A equals 118 at about 8.5 MeV, releasing roughly 215 MeV per fission against a measured 200.
Both arrows point the same way — uphill. Any reaction that moves nucleons to a higher binding energy per nucleon releases energy, and there are two ways to climb: join light nuclei together, or split heavy ones apart.

That is the whole logic of nuclear energy, and it is worth stating carefully because the “uphill” direction is counter-intuitive. A nucleus with more binding energy per nucleon is more tightly bound, so its nucleons have less energy left over. Moving up the curve therefore means shedding energy — and that shed energy is what comes out of a reactor or a star.

total binding energy\( E_b = A \times (E_b/A) \)
energy released\( E_b(\text{after}) - E_b(\text{before}) \)

The steepness of the two sides also explains why fusion is the bigger prize. Climbing from hydrogen to helium gains about 7 MeV per nucleon; splitting uranium into two mid-weight fragments gains under 1. Fission wins on convenience, not on yield.

🤝What holds a nucleus together

Every proton in a nucleus repels every other proton electrostatically, and at a separation of \( 10^{-15} \) m that repulsion is enormous. Something stronger must be acting, and it is: the strong nuclear force. It attracts nucleons to one another — proton to proton, proton to neutron, neutron to neutron alike — and at about 1 fm it is roughly a hundred times stronger than the electric repulsion.

Its decisive property, though, is not its strength but its range. The strong force is essentially gone beyond about 3 fm. The electric force is not: it falls off as \( 1/r^2 \), which is slow, and it reaches right across even the largest nucleus.
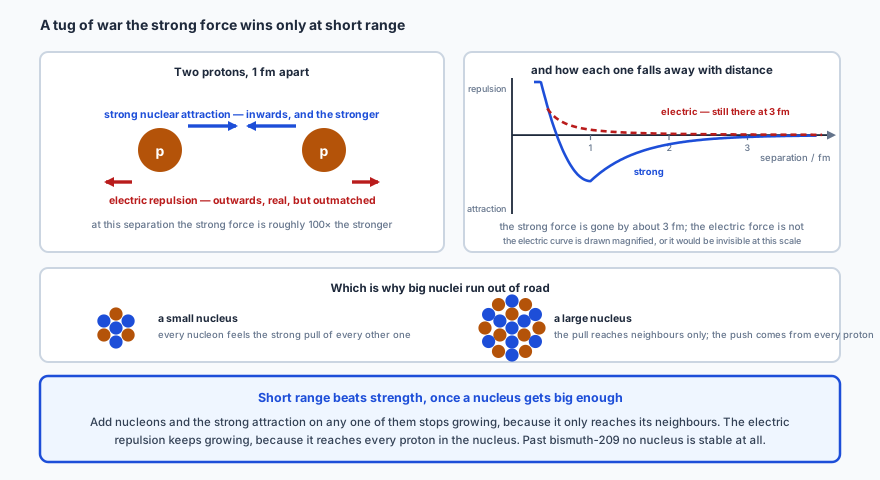
Top left, two protons one femtometre apart, each drawn with two arrows: a long blue arrow pointing inwards towards the other proton, labelled strong nuclear attraction, and a shorter red arrow pointing outwards, labelled electric repulsion, with a note that at this separation the strong force is roughly a hundred times the stronger. Top right, a graph of force against separation in femtometres with repulsion above the axis and attraction below: the strong force curve is strongly repulsive below about half a femtometre, swings to a deep attractive minimum near one femtometre, and returns to zero by about three; the electric curve is repulsive everywhere and decays slowly, still present at three femtometres, with a note that it is drawn magnified or it would be invisible. Below, two clusters of nucleons: a small nucleus of seven, where every nucleon feels the strong pull of every other one, and a large nucleus of nineteen, where the pull reaches neighbours only while the push comes from every proton.
The graph is the argument. Because attraction is short-ranged and repulsion is not, adding nucleons eventually stops helping — and past bismuth-209 no nucleus is stable at all.

Follow that through. In a small nucleus every nucleon is within range of every other one, so the attraction grows as fast as the repulsion does. In a large nucleus a given nucleon still only feels the strong pull of its immediate neighbours — that number stops growing — while it feels the electric push of every proton in the nucleus, and that number keeps growing. Sooner or later the repulsion wins.

🗺️Which nuclei are unstable, and which way they move

Plot every nuclide with its neutron number against its proton number and the stable ones do not scatter: they lie along a narrow band. For light nuclei the band follows \( N = Z \). As \(Z\) grows the band bends steadily above that line, because extra neutrons add strong attraction without adding any electric repulsion at all. By uranium the ratio is about 1.6 neutrons per proton.
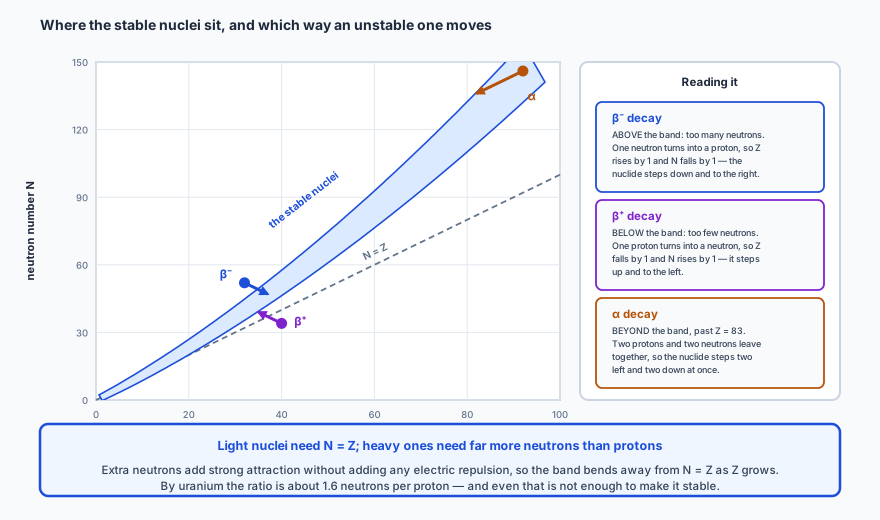
A graph of neutron number N against proton number Z. A shaded band of stable nuclei runs from the origin, following the dashed N equals Z line at first and then bending progressively above it, reaching about 146 neutrons for 92 protons. Three unstable nuclides are marked with arrows showing which way each moves. One sits above the band, labelled beta minus, with its arrow pointing down and to the right. One sits below the band, labelled beta plus, with its arrow pointing up and to the left. One sits at the far top right beyond the band, labelled alpha, with its arrow pointing down and to the left. A key at the right explains each case: beta minus for too many neutrons, where a neutron turns into a proton so Z rises by one and N falls by one; beta plus for too few neutrons, the reverse; and alpha beyond Z equals 83, where two protons and two neutrons leave together so the nuclide steps two left and two down at once.
HLThe plot turns “which decay does this nuclide undergo?” into a question about geometry: find the nuclide, find the band, and the decay is whichever move heads back towards it.

The band is the answer to a question exams ask often: why does this particular nuclide decay the way it does? A nuclide above the band has too many neutrons, so it converts one into a proton — that is beta-minus decay, and it steps down and to the right. A nuclide below the band has too few, so it converts a proton into a neutron — beta-plus decay, stepping up and to the left. And anything past \( Z = 83 \) is simply too big whatever its ratio, so it sheds an entire alpha particle and steps two places diagonally.

☢️Alpha, beta and gamma

Three kinds of radiation come out of unstable nuclei, and they were named before anybody knew what they were — which is why the names are just the first three Greek letters.

alpha, \( ^{4}_{2}\alpha \)a helium nucleus: two protons and two neutrons, charge \(+2\)
beta-minus, \( ^{\ 0}_{-1}\beta \)an electron created in the nucleus, charge \(-1\)
beta-plus, \( ^{0}_{+1}\beta \)a positron — antimatter — charge \(+1\)
gamma, \( ^{0}_{0}\gamma \)a high-energy photon: no charge, no mass

Their properties line up in a strict order, and the ordering is not a coincidence: ionising is how a radiation loses its energy, so the most strongly ionising is necessarily the least penetrating.
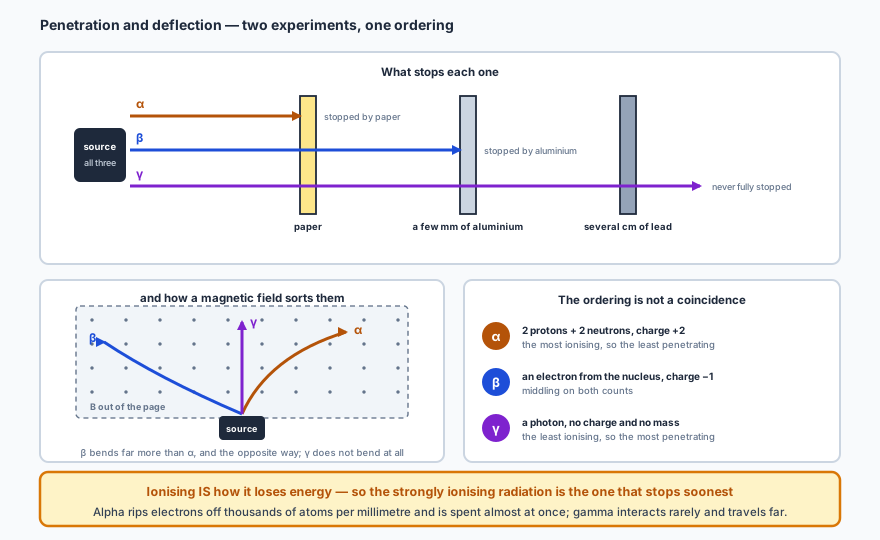
Top panel, a penetration experiment: a source emitting all three radiations sends three rays to the right through successive barriers. The alpha ray is stopped by a sheet of paper, the beta ray passes the paper but is stopped by a few millimetres of aluminium, and the gamma ray passes both and is only reduced, never fully stopped, by several centimetres of lead. Bottom left, the same three radiations entering a magnetic field directed out of the page: the alpha is barely bent and curves one way, the beta is bent hard and curves the opposite way, and the gamma continues straight on undeflected. Bottom right, the three set out in rows: alpha is two protons and two neutrons with charge plus two, the most ionising and so the least penetrating; beta is an electron from the nucleus with charge minus one, middling on both counts; gamma is a photon with no charge and no mass, the least ionising and so the most penetrating.
Two experiments, one ordering. In the magnetic field the beta bends far more than the alpha because it is thousands of times lighter, and the opposite way because its charge has the opposite sign; the gamma does not bend because it has no charge to push on.

⚖️Writing decay equations that balance

Every decay equation obeys two conservation rules, and writing both sums out is the whole method: nucleon number balances, and proton number balances. Get those two right and the daughter nuclide follows automatically — look the new \(Z\) up in the periodic table and it tells you the element.
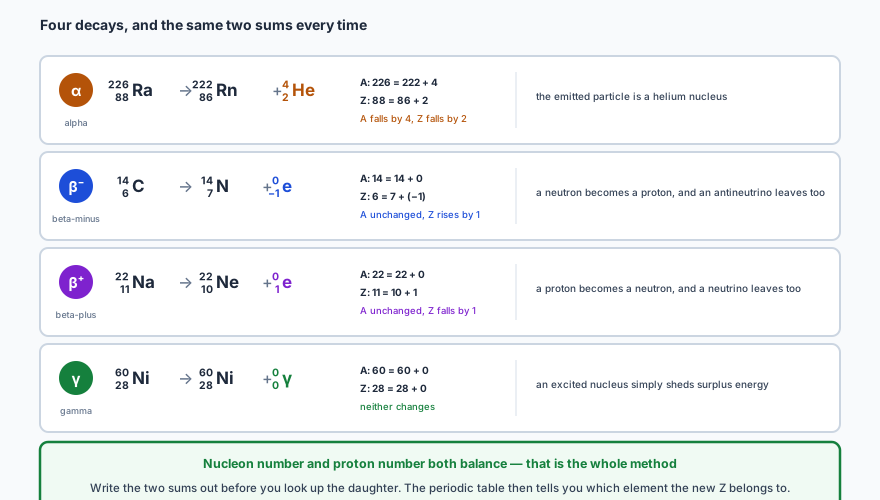
Four rows, one per decay mode, each showing the full equation and the two balancing sums. Alpha: radium-226 goes to radon-222 plus a helium-4 nucleus, with A 226 equals 222 plus 4 and Z 88 equals 86 plus 2, so A falls by four and Z falls by two. Beta-minus: carbon-14 goes to nitrogen-14 plus an electron of nucleon number zero and proton number minus one, with A 14 equals 14 plus 0 and Z 6 equals 7 plus minus one, so A is unchanged and Z rises by one, and an antineutrino leaves too. Beta-plus: sodium-22 goes to neon-22 plus a positron, with A unchanged and Z falling by one, and a neutrino leaves too. Gamma: excited nickel-60 goes to nickel-60 plus a gamma photon of nucleon number zero and proton number zero, so neither number changes and an excited nucleus simply sheds surplus energy.
The gamma row looks trivial and is worth attention: because a photon carries neither \(A\) nor \(Z\), gamma emission changes no nuclide numbers at all. It is the same nucleus, in a lower energy state.

✏️Worked example 2 — a decay chain, and the energy it releases

Polonium-210 (\(Z = 84\)) decays by alpha emission to a daughter that is stable. (a) Write the decay equation and identify the daughter. (b) The atomic masses are: polonium-210, 209.982874 u; the daughter, 205.974465 u; helium-4, 4.002603 u. Find the energy released.

(a) Balance the two numbers. Alpha emission takes 4 from \(A\) and 2 from \(Z\):

\[ ^{210}_{\ 84}\text{Po} \rightarrow\ ^{206}_{\ 82}\text{Pb} + ^{4}_{2}\text{He} \]

Check both: \( 210 = 206 + 4 \) and \( 84 = 82 + 2 \). \( Z = 82 \) is lead, and lead-206 is indeed stable — it is where one of the natural decay chains ends.

(b) The energy released is the mass that went missing. Take the mass of the parent and subtract the masses of everything that came out:

\[ \Delta m = 209.982874 - (205.974465 + 4.002603) = 0.005806\ \text{u} \]
\[ E = 0.005806 \times 931.5 = 5.41\ \text{MeV} \]
Sanity check. Alpha decays release between about 4 and 9 MeV, essentially always — below 4 the decay is too slow to see and above 9 the nuclide does not survive long enough to be studied. 5.41 sits comfortably inside that window. Note also that using atomic masses throughout is legitimate here: there are 84 electrons on the left and 82 + 2 = 84 on the right, so they cancel exactly.
The trap: the alpha particle does not get all the energy. Momentum has to balance as well, and the parent was at rest, so the daughter recoils. Sharing 5.41 MeV between a mass-4 alpha and a mass-206 recoil gives the alpha \( 206/210 \) of it, about 5.30 MeV, with the remaining 0.11 MeV going into the lead nucleus. For alpha decay the split is lopsided enough that people forget the recoil exists — but a question that gives you both masses and asks for the alpha’s kinetic energy is asking for exactly this.

🌌Antimatter, and the particle nobody could see

Beta-plus decay produces a positron: an electron’s antiparticle, identical in mass and opposite in charge. Antimatter is a real prediction of relativistic quantum mechanics, not a curiosity, and it is put to work daily — a PET scanner is a positron emission tomograph, built around exactly this decay.

But the more interesting story is the one the beta spectrum told. If beta decay produced only a daughter and an electron, conservation of energy and momentum would fix the electron’s energy at a single value — just as it does for the alpha in a two-body alpha decay. Alpha particles from a given nuclide do all arrive with the same energy. Beta particles do not: they arrive with every energy from nearly zero up to a maximum, and almost all of them fall short of it.
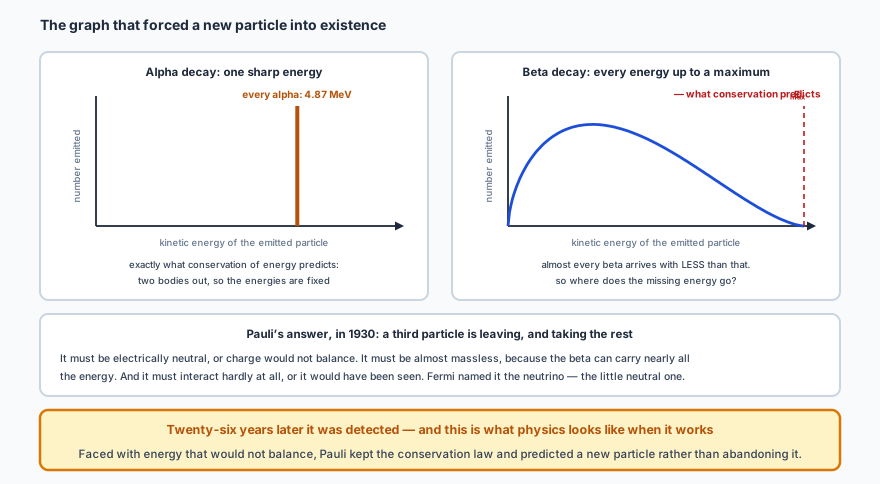
Two graphs of the number of particles emitted against their kinetic energy. On the left, alpha decay gives a single sharp vertical line at one energy, 4.87 MeV, described as exactly what conservation of energy predicts for two bodies out. On the right, beta decay gives a broad continuous hump rising from zero, peaking around a third of the way along and falling back to zero at a maximum energy marked by a dashed line labelled E max, what conservation predicts; almost every beta arrives with less than that, raising the question of where the missing energy goes. Below, Pauli's answer of 1930: a third particle is leaving and taking the rest, and it must be electrically neutral so that charge balances, almost massless because the beta can carry nearly all the energy, and barely interacting or it would already have been seen. Fermi named it the neutrino.
Faced with energy that would not balance, Pauli kept the conservation law and predicted a new particle instead. It took twenty-six years to detect one — and this is a better illustration of how physics actually works than most set-piece examples.

So beta decay emits three particles, not two, and the beta shares the available energy with an almost undetectable third body. That is why a beta-minus equation is only complete with an antineutrino \( \bar{\nu} \) on the right, and a beta-plus equation with a neutrino \( \nu \):

beta-minus\( ^{1}_{0}\text{n} \rightarrow\ ^{1}_{1}\text{p} + ^{\ 0}_{-1}\text{e} + \bar{\nu} \)
beta-plus\( ^{1}_{1}\text{p} \rightarrow\ ^{1}_{0}\text{n} + ^{0}_{+1}\text{e} + \nu \)

Notice that beta-plus decay turns a proton into a heavier neutron, which cannot happen to a free proton — it only goes inside a nucleus, where the surrounding binding energy pays the difference. A free neutron, on the other hand, really does beta-minus decay on its own, with a half-life of about ten minutes.

📊HLNuclear energy levels

Gamma emission happens because a nucleus, like an atom, has discrete energy levels. After an alpha or beta decay the daughter is often left in an excited state, and it drops to the ground state by emitting one or more photons. The evidence that the levels are discrete is exactly the evidence used for atoms in E.1: the emitted photon energies are sharp.
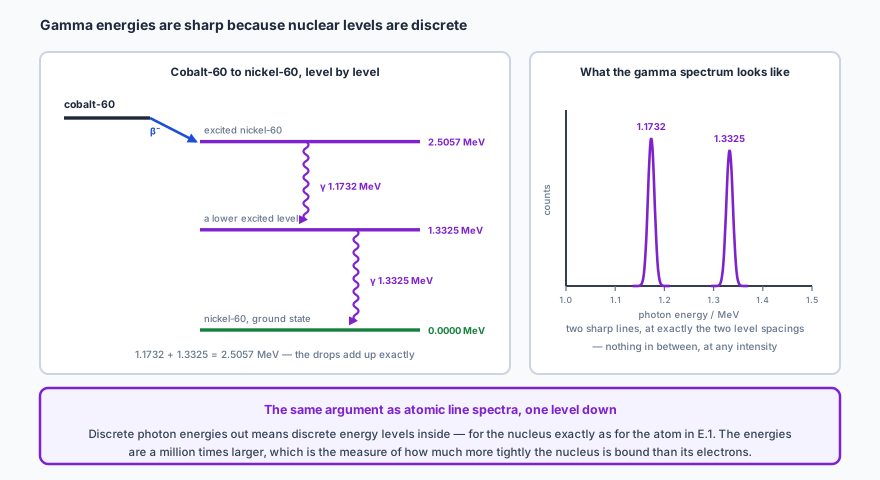
On the left, an energy level diagram. Cobalt-60 sits at the top and beta-minus decays to an excited state of nickel-60 at 2.5057 MeV. That state drops by a gamma photon of 1.1732 MeV to a lower excited level at 1.3325 MeV, which drops by a second gamma of 1.3325 MeV to the nickel-60 ground state at zero. A note records that 1.1732 plus 1.3325 equals 2.5057 MeV, so the drops add up exactly. On the right, the gamma spectrum a detector records: two very narrow peaks at 1.1732 and 1.3325 MeV on an energy axis running from 1.0 to 1.5, with nothing in between at any intensity.
Cobalt-60 is the standard example because its two gamma energies are so clean. The nuclear level spacings here are of order 1 MeV, about a million times the electronvolt spacings of atomic levels — a direct measure of how much more tightly the nucleus is bound.

The argument runs in the same direction as it did for line spectra: a continuous range of photon energies out would mean a continuous range of energies inside, and that is not what a detector sees. Two sharp lines mean two definite level gaps.

🎲Random decay, activity and half-life

Radioactive decay is random and spontaneous. Random means no observation can tell you when a particular nucleus will decay — each one has the same chance in the next second as every other, no matter how long it has already sat there. Spontaneous means nothing external triggers it: heating, cooling, compressing or chemically combining a sample changes nothing.

Both statements sound like defeat, and they are the opposite. Individually unpredictable events in huge numbers give a completely predictable average, in the same way a single coin toss is unpredictable while a million tosses give very nearly half a million heads. A sample of any usable size contains \( 10^{20} \) nuclei or more, so the bulk behaviour is smooth.

Two quantities carry that behaviour. Activity \(A\) is the number of decays per second, measured in becquerels (1 Bq = 1 decay per second). Half-life \( t_{1/2} \) is the time for half the undecayed nuclei to decay — equivalently, for the activity to halve, since activity is proportional to how many nuclei remain.
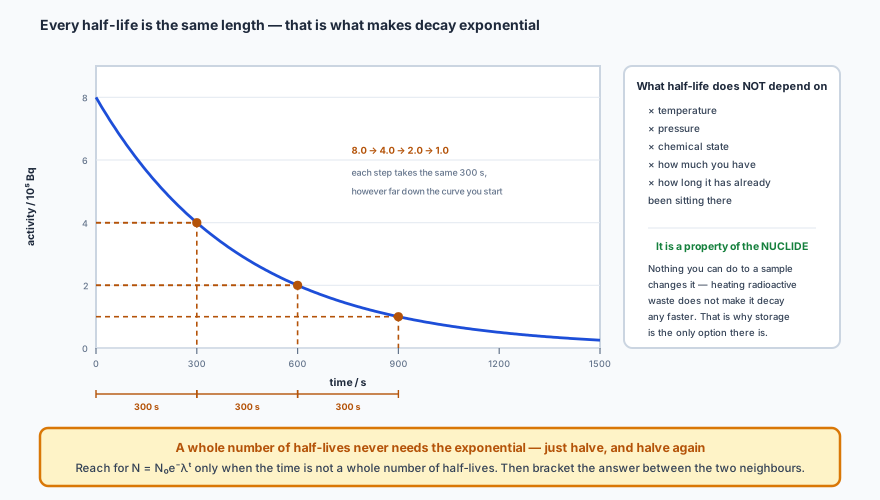
A graph of activity in units of ten to the fifth becquerels against time in seconds, falling as a smooth exponential curve from 8.0 at time zero. Dashed construction lines mark three successive halvings: 4.0 at 300 seconds, 2.0 at 600 seconds and 1.0 at 900 seconds, with brackets under the time axis showing that each of the three intervals is the same 300 seconds. A note records the sequence 8.0 to 4.0 to 2.0 to 1.0 and that each step takes the same 300 seconds however far down the curve you start. A panel at the right lists what half-life does not depend on: temperature, pressure, chemical state, how much you have, and how long it has already been sitting there. It concludes that half-life is a property of the nuclide, that nothing done to a sample changes it, and that this is why storage is the only option for radioactive waste.
What makes the curve exponential is precisely that every halving takes the same time. Read off any starting point you like, follow it down to half that value, and the interval is 300 s.

✏️Worked example 3 — half-lives without the exponential

A sample of iodine-131, half-life 8.0 days, has an initial activity of \( 4.8 \times 10^{6} \) Bq. Find its activity after 24 days.

Count the half-lives first. \( 24 / 8.0 = 3 \), a whole number, so the activity simply halves three times:

\[ 4.8 \rightarrow 2.4 \rightarrow 1.2 \rightarrow 0.60 \times 10^{6}\ \text{Bq} \]

So the activity after 24 days is \( 6.0 \times 10^{5} \) Bq.

Sanity check. Three halvings means a factor of \( 2^3 = 8 \), and \( 4.8/8 = 0.60 \). It agrees. Whenever the time is a whole number of half-lives, this is the whole calculation — reaching for \( N = N_0e^{-\lambda t} \) here wastes a minute and invites an arithmetic slip.
The trap: halve the count rate, not the meter reading. A Geiger counter always reads the source plus the background. Suppose it reads 540 counts per minute where the background is 30. The activity that halves is \( 540 - 30 = 510 \), so after two half-lives the true rate is \( 510/4 = 128 \) — and the meter will then read \( 128 + 30 = 158 \) counts per minute, not \( 540/4 = 135 \). Subtract the background at the start, do the physics, then add it back on at the end.

📐HLThe exponential decay law

Put the randomness into symbols. Every undecayed nucleus has the same fixed probability of decaying per unit time, called the decay constant \( \lambda \). So the number decaying per second is proportional to the number left:

\[ \frac{dN}{dt} = -\lambda N \]

The minus sign says \(N\) is falling. This is the defining equation of exponential decay, and integrating it gives the three relations you will actually use:

how many are left\( N = N_0e^{-\lambda t} \)
activity\( A = \lambda N \)
and so\( A = A_0e^{-\lambda t} \)
half-life\( \lambda = \dfrac{\ln 2}{t_{1/2}} \)

That last one comes straight out of the first: put \( N = N_0/2 \) and \( t = t_{1/2} \), and \( \tfrac{1}{2} = e^{-\lambda t_{1/2}} \) rearranges to \( \lambda t_{1/2} = \ln 2 \). It is worth deriving once so that you never have to remember which way up it goes.
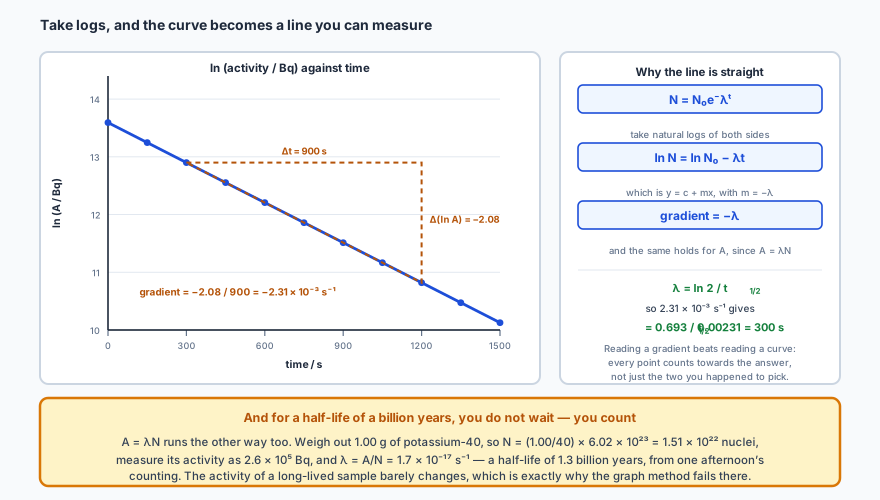
On the left, a graph of the natural logarithm of activity in becquerels against time in seconds. The points lie on a straight line falling from about 13.6 at time zero. A dashed right-angled triangle between 300 and 1200 seconds shows a run of 900 seconds and a fall of 2.08 in ln A, giving a gradient of minus 2.31 times ten to the minus three per second. On the right, the algebra: starting from N equals N nought e to the minus lambda t, taking natural logs of both sides gives ln N equals ln N nought minus lambda t, which is the form y equals c plus m x with m equal to minus lambda, so the gradient is minus lambda; and the same holds for activity since A equals lambda N. Below that, lambda equals ln 2 over the half-life, so 2.31 times ten to the minus three per second gives a half-life of 0.693 divided by 0.00231, which is 300 seconds. A footer explains how a half-life of a billion years is measured without waiting, by weighing out one gram of potassium-40 to get 1.51 times ten to the twenty-two nuclei, measuring an activity of 2.6 times ten to the fifth becquerels, and dividing to find lambda.
HLTaking logs turns the curve into a line, and a line has a gradient you can measure with every point contributing — not just the two you happened to pick off a curve.

✏️HLWorked example 4 — the same iodine sample, in full

For that iodine-131 sample (half-life 8.0 days, initial activity \( 4.8 \times 10^{6} \) Bq), find (a) the decay constant, (b) the number of undecayed nuclei present at the start, and (c) the activity after 20 days.

(a) Decay constant. The half-life must go into seconds, or the activity will not come out in becquerels:

\[ t_{1/2} = 8.0 \times 24 \times 3600 = 6.912 \times 10^{5}\ \text{s} \]
\[ \lambda = \frac{\ln 2}{t_{1/2}} = \frac{0.693}{6.912 \times 10^{5}} = 1.0 \times 10^{-6}\ \text{s}^{-1} \]

(b) Number of nuclei. Rearrange \( A = \lambda N \):

\[ N = \frac{A}{\lambda} = \frac{4.8 \times 10^{6}}{1.0 \times 10^{-6}} = 4.8 \times 10^{12} \]

(c) Activity after 20 days. Twenty days is 2.5 half-lives — not a whole number — so this one does need the exponential. With \( t = 20 \times 86400 = 1.728 \times 10^{6} \) s:

\[ A = 4.8 \times 10^{6} \times e^{-(1.0 \times 10^{-6})(1.728 \times 10^{6})} = 4.8 \times 10^{6} \times e^{-1.73} = 8.5 \times 10^{5}\ \text{Bq} \]
Sanity check. Bracket it. Twenty days lies between two half-lives (16 days, \( 1.2 \times 10^{6} \) Bq) and three (24 days, \( 6.0 \times 10^{5} \) Bq), so the answer must fall between those two numbers. \( 8.5 \times 10^{5} \) does. Do this every time: it catches a dropped minus sign in the exponent instantly, because that would give an answer far above \( A_0 \).

The same two equations also solve the problem that looks impossible: how do you measure a half-life of a billion years? Not by waiting. Weigh out a known mass, work out \(N\) from the molar mass and Avogadro’s constant, measure the activity, and use \( \lambda = A/N \). One gram of potassium-40 contains \( 1.51 \times 10^{22} \) nuclei and has an activity of about \( 2.6 \times 10^{5} \) Bq, which gives \( \lambda = 1.7 \times 10^{-17}\ \text{s}^{-1} \) and a half-life of 1.3 billion years — from an afternoon’s counting.

🌍Background radiation

Radiation is not something we introduced. A counter sitting on a bench with no source anywhere near it still registers counts, and that background comes overwhelmingly from natural sources: radon gas seeping out of the ground, gamma rays from rocks and building materials, cosmic rays, and the potassium-40 inside our own bodies. The artificial contribution is almost entirely medical.
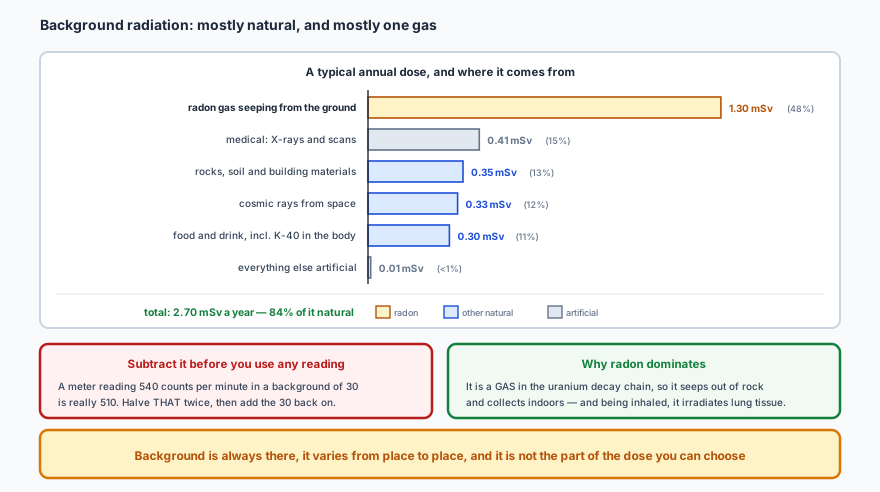
A horizontal bar chart of a typical annual radiation dose in millisieverts, ordered from largest. Radon gas seeping from the ground is by far the largest at 1.30 millisieverts, about 48 per cent, and is highlighted. Medical X-rays and scans account for 0.41, rocks soil and building materials 0.35, cosmic rays from space 0.33, food and drink including potassium-40 in the body 0.30, and everything else artificial 0.01. The total is 2.70 millisieverts a year, of which 84 per cent is natural. Two notes follow: that a meter reading 540 counts per minute against a background of 30 is really 510, which is the number to halve before adding the 30 back on; and that radon dominates because it is a gas in the uranium decay chain, so it seeps out of rock and collects indoors, and being inhaled it irradiates lung tissue directly.
The single largest contribution is a gas nobody can see, which is why radon surveys exist. Note also how small “everything else artificial” is — the fallout, industry and power-generation share together is well under one per cent.

🧪What radioactivity is used for

The applications all rest on one of two facts: radiation penetrates matter in a way that depends predictably on thickness, or decay happens on a clock that nothing can alter.

medical imaginga short-lived gamma emitter is taken up by one organ and tracked from outside
radiotherapyfocused gamma from cobalt-60 kills tumour cells
sterilisationgamma kills bacteria inside sealed packaging, with no heat
thickness gaugesthe beta getting through sheet metal reports its thickness continuously
smoke alarmssmoke absorbs alpha from americium-241 and drops the current
carbon datingthe carbon-14 left in dead organic material gives its age

Choosing the isotope is the physics. A medical tracer wants a gamma emitter so the radiation escapes the body, with a half-life of hours — long enough to image, short enough to clear. A thickness gauge wants beta, because alpha would not get through at all and gamma would get through almost regardless. A smoke alarm wants alpha precisely because it is stopped by almost nothing.

✏️Worked example 5 — dating a piece of wood

Living wood has a carbon-14 activity of 15.3 counts per minute per gram of carbon. A sample from an archaeological site gives 3.8 counts per minute per gram. Carbon-14 has a half-life of 5730 years. How old is the sample?

Find the fraction remaining. \( 3.8 / 15.3 = 0.248 \), which is almost exactly a quarter.

Recognise the fraction. A quarter is two halvings, so the answer is two half-lives:

\[ t = 2 \times 5730 = 11\,460 \approx 1.1 \times 10^{4}\ \text{years} \]

HLThe same thing with the decay law. If the fraction were not a neat one, take logs of \( A = A_0e^{-\lambda t} \):

\[ \lambda = \frac{\ln 2}{5730} = 1.21 \times 10^{-4}\ \text{y}^{-1}, \qquad t = \frac{1}{\lambda}\ln\!\left(\frac{A_0}{A}\right) = \frac{\ln(1/0.248)}{1.21 \times 10^{-4}} = 1.2 \times 10^{4}\ \text{years} \]
Sanity check. The two routes agree, and they should: 0.248 is a shade under a quarter, so the exponential answer comes out a shade over two half-lives. The method also shows the limit of the technique — after about ten half-lives, roughly 60 000 years, less than 0.1% of the carbon-14 is left and the count rate is lost in the background.

📝Practise

Work through these, then reveal the answer. Each question targets a different objective from the list above, and the later ones are HL.

1. State what makes carbon-12 and carbon-14 isotopes of the same element, and explain why they behave identically in chemical reactions but not in the nucleus.
Both have \( Z = 6 \) — six protons — and differ only in neutron number, 6 against 8. Chemistry is decided by the electrons, and a neutral atom has as many electrons as protons, so both form the same compounds and are taken up by living things in the same proportions. Nuclear stability is decided by the balance of forces inside the nucleus, and there the two extra neutrons matter: carbon-12 is stable and carbon-14 has a half-life of 5730 years.
2. The nuclear mass of lithium-7 is 7.014356 u. Find its binding energy per nucleon. Take \( m_p = 1.007276 \) u and \( m_n = 1.008665 \) u.
Lithium has \( Z = 3 \), so lithium-7 is 3 protons and 4 neutrons.
Parts: \( 3(1.007276) + 4(1.008665) = 7.056488 \) u.
Mass defect: \( \Delta m = 7.056488 - 7.014356 = 0.042132 \) u.
Binding energy: \( 0.042132 \times 931.5 = 39.25 \) MeV.
Per nucleon: \( 39.25 / 7 = 5.61 \) MeV. That is well below the 8.8 MeV peak, as it should be for a nucleus this light — it sits on the steeply rising part of the curve, which is why lithium is a fusion fuel.
3. Iron-56 has a binding energy per nucleon of 8.79 MeV and uranium-238 has 7.57 MeV. Which nucleus has the greater total binding energy, and which is the more tightly bound? Explain why those are different questions.
Total binding energy is \( A \times (E_b/A) \): for iron-56, \( 56 \times 8.79 = 492 \) MeV; for uranium-238, \( 238 \times 7.57 = 1802 \) MeV. So uranium has by far the greater total — it simply has four times as many nucleons to bind. Tightness of binding is the energy per nucleon, and there iron wins, 8.79 against 7.57. Iron-56 is the more tightly bound, which is why uranium can release energy by splitting towards iron and iron can release none by splitting at all.
4. Explain why the strong nuclear force being short-ranged, rather than being strong, is what limits how large a stable nucleus can be.
The strong force acts only out to about 3 fm, so each nucleon is attracted by its immediate neighbours only, and adding more nucleons does not increase the attraction any one of them feels. The electrostatic repulsion between protons falls off as \( 1/r^2 \) and so acts right across the nucleus: every proton repels every other one, and that total does keep growing as the nucleus gets bigger. Eventually repulsion outgrows attraction, which is why no nuclide beyond bismuth-209 is stable. Extra neutrons delay the crisis, because they add attraction without adding repulsion, which is why the stability band bends above \( N = Z \).
5. Complete the alpha decay of uranium-238, and the beta-minus decay of carbon-14, including every emitted particle.
\( ^{238}_{\ 92}\text{U} \rightarrow\ ^{234}_{\ 90}\text{Th} + ^{4}_{2}\text{He} \) — alpha decay takes 4 from \(A\) and 2 from \(Z\), and both sums balance: \( 238 = 234 + 4 \), \( 92 = 90 + 2 \).

\( ^{14}_{\ 6}\text{C} \rightarrow\ ^{14}_{\ 7}\text{N} + ^{\ 0}_{-1}\text{e} + \bar{\nu} \) — a neutron becomes a proton, so \(A\) is unchanged and \(Z\) rises by one. The antineutrino must be there: it was proposed precisely because beta particles emerge with a continuous range of energies rather than the single value a two-body decay would give.
6. A nuclide lies above the band of stability. State which decay it will undergo, and explain what that does to its position on an N–Z plot.
Above the band means too many neutrons for its proton number, so it undergoes beta-minus decay: a neutron turns into a proton, emitting an electron and an antineutrino. \(Z\) rises by one and \(N\) falls by one, so the nuclide moves one step down and one step to the right — diagonally towards the band. (A nuclide below the band has too few neutrons and does the reverse, beta-plus decay, moving up and to the left.)
7. A Geiger counter reads 640 counts per minute next to a source whose half-life is 12 minutes. The background count is 40 counts per minute. What will the counter read 36 minutes later?
Subtract the background first: the source alone gives \( 640 - 40 = 600 \) counts per minute. 36 minutes is three half-lives, so that falls by a factor of \( 2^3 = 8 \) to \( 600/8 = 75 \). The counter also still detects the background, so it will read \( 75 + 40 = 115 \) counts per minute. Halving the 640 directly gives 80, which is wrong — the background does not decay.
8. Explain why the beta spectrum is continuous while the alpha spectrum is a single sharp line, and what was concluded from that.
Alpha decay is a two-body process: the daughter and the alpha share a fixed energy release, and conservation of energy and momentum together fix how it splits, so every alpha from a given nuclide has the same energy. If beta decay were also two-body, every beta would likewise have one energy — but measurements show a continuous spread from nearly zero up to a maximum, with most betas falling short. Pauli concluded that a third, undetected particle was carrying the balance. It had to be neutral (charge already balances), almost massless (the beta can take nearly all the energy) and barely interacting (nothing had seen it). It is the neutrino, detected experimentally 26 years later.
9. HLA sample starts with \( 1.0 \times 10^{12} \) undecayed nuclei and has a decay constant of \( 2.31 \times 10^{-3} \) s−1. How many remain after 600 s, and what is the initial activity?
\( N = N_0e^{-\lambda t} = 1.0 \times 10^{12} \times e^{-(2.31 \times 10^{-3})(600)} = 1.0 \times 10^{12} \times e^{-1.386} = 2.5 \times 10^{11} \).
Check it: \( t_{1/2} = \ln 2 / \lambda = 0.693/(2.31 \times 10^{-3}) = 300 \) s, so 600 s is exactly two half-lives and a quarter should remain. It does.

Initial activity: \( A_0 = \lambda N_0 = (2.31 \times 10^{-3})(1.0 \times 10^{12}) = 2.3 \times 10^{9} \) Bq.
10. HLA graph of \( \ln A \) against \(t\) for a radioactive sample is a straight line of gradient \( -4.62 \times 10^{-4} \) s−1. Find the half-life, and explain why this method is preferred to reading halvings off the decay curve.
Taking logs of \( A = A_0e^{-\lambda t} \) gives \( \ln A = \ln A_0 - \lambda t \), which is \( y = c + mx \) with gradient \( -\lambda \). So \( \lambda = 4.62 \times 10^{-4} \) s−1, and \[ t_{1/2} = \frac{\ln 2}{\lambda} = \frac{0.693}{4.62 \times 10^{-4}} = 1500\ \text{s} = 25\ \text{minutes} \] The log plot is preferred because a straight line uses every data point to fix one gradient, so random fluctuations in the count rate average out, and because a straight line is far easier to judge by eye than an exponential curve — a systematic problem shows up immediately as curvature. Reading two points off a curve throws away all the others.

🔗Go deeper — other people’s work

These are external resources, not mine. If one stops working, tell me and everything above it on this page still stands.

  • HyperPhysics — radioactivity, decay modes and half-life
  • xkcd — the radiation dose chart, for a sense of scale of real exposures
  • The IAEA Live Chart of Nuclides — the real N–Z plot, every measured nuclide on it