HomeLearning HubIB DP PhysicsT.1 Experimental techniques
T.1

Experimental techniques

Tools and inquiry · skills assessed across the whole course

Every number in every other topic on this site started as somebody reading an instrument. This page is about doing that well — and, just as importantly, about knowing what the number you get is actually worth.

🎯What you need to be able to do

  • Carry out a risk assessment, and say plainly what the safety, ethical and environmental issues are — or that there are none.
  • State the uncertainty in a reading from the instrument itself: half a division for analogue, a whole division for digital.
  • Read a metre rule, vernier calipers and a micrometer screw gauge, and check each for zero error.
  • Measure mass, time, volume, current, potential difference, temperature, force and angle, and choose the right instrument for each.
  • Reduce the uncertainty in a small quantity by measuring many of them at once.
  • Explain why an ammeter goes in series and a voltmeter in parallel, and what the ideal resistance of each would be.
  • Describe how intensity is measured, and that it depends on amplitude squared.

⚠️Safety comes first, and it is quick

Before any practical work, do a risk assessment: identify anything that could cause harm, and say what you will do about it. Physics is rarely dangerous, and that is the point — the assessment is usually short, and it is not a hunt for imaginary hazards.

trailing cablesa trip hazard — route them behind the bench
low-voltage circuitscan still overheat: watch the current rating of the components
high voltagegenuinely dangerous — never work on a live circuit
heating and open flamesburns, and a fire risk from anything nearby
radioactive sourceshandle with tongs, point away from people, back in the store

There are also ethical and environmental considerations. Ethical issues are uncommon in physics but do arise if human volunteers are involved — reaction-time experiments, say. Environmental issues arise mostly from disposing of chemicals or of anything radioactive.

If there really is nothing of concern, say so. A single sentence stating that the procedure raises no particular safety, ethical or environmental issues shows the reader you thought about it. Leaving the section out entirely does not.

📏What a single reading is worth

No measurement is exact, so every reading needs an uncertainty attached to it. The starting point is the instrument's readability — the finest distinction it can make — and there are two rules, depending on how the instrument presents its answer.
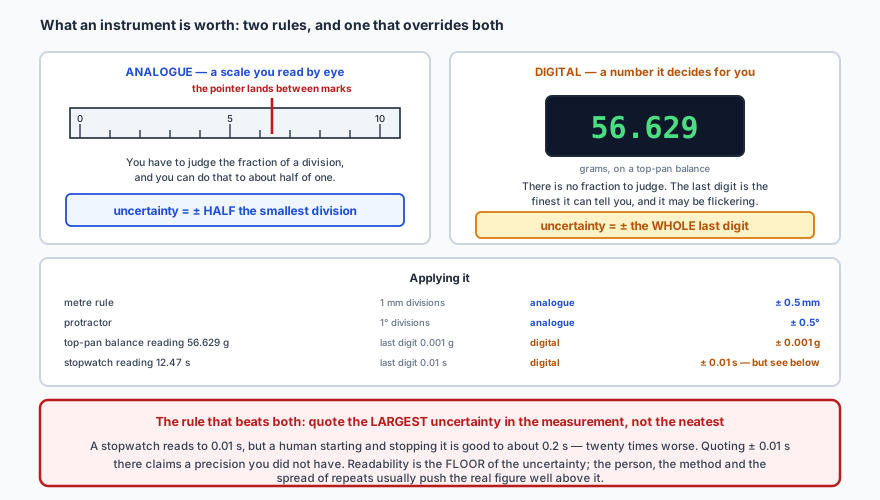
Two panels contrasting analogue and digital instruments. On the left, an analogue scale with a pointer landing between two marks: because you have to judge the fraction of a division by eye, and can do so to about half of one, the uncertainty is plus or minus half the smallest scale division. On the right, a digital top-pan balance displaying 56.629 grams: there is no fraction to judge, the last digit is the finest it can report and it may be flickering, so the uncertainty is plus or minus the whole last digit. A table applies both rules to a metre rule, a protractor, a balance and a stopwatch. A note beneath warns that readability is only the floor of the uncertainty, and that a stopwatch reading to 0.01 s is really good to about 0.2 s because of human reaction time, so the larger figure is the one to quote.
Readability is the best an instrument could do, not what your measurement achieved. If the method, the operator or the spread of repeats is worse — and it usually is — quote the larger figure.
analogue scaleuncertainty = ± half the smallest division
digital displayuncertainty = ± the whole last digit

The reason the two rules differ is worth a moment. On an analogue scale you can see that the pointer is between two marks and estimate how far, so you genuinely get half a division. A digital display has already made that decision for you and thrown away the rest; the last digit is all you have, and it may well be flickering between two values.

📐Measuring length

A metre rule reads to the nearest millimetre and, used carefully with the eye directly above the mark, gives ± 0.5 mm. Two things spoil it: parallax, from viewing at an angle, and the fact that you need a reading at both ends, so two uncertainties of ± 0.5 mm combine to ± 1 mm in the length.

For anything smaller, two instruments remove the guesswork by adding a second scale.
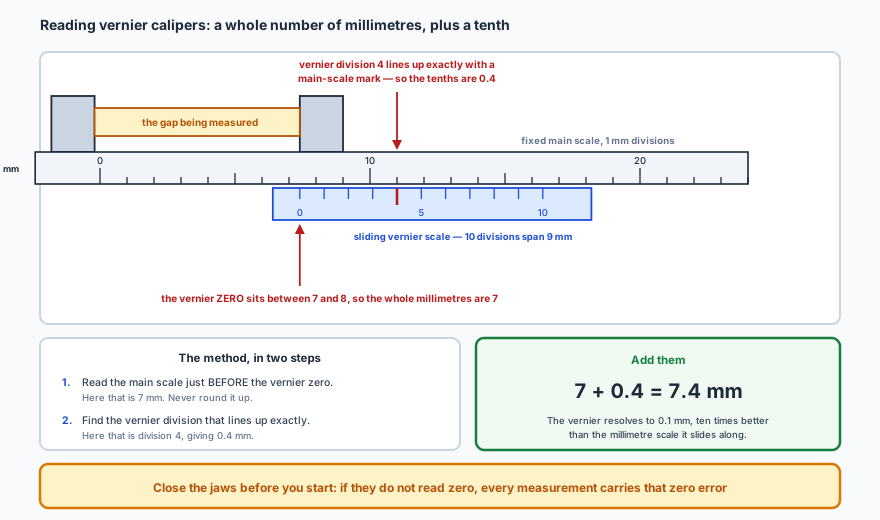
Vernier calipers with an object gripped between the jaws. The fixed main scale is marked in millimetres and the sliding vernier scale beneath it carries ten divisions spanning nine millimetres, so the two sets of marks face each other. The vernier zero lies between the 7 and 8 millimetre marks, which gives the whole millimetres as 7, and vernier division 4 lines up exactly with a main-scale mark, which gives the tenths as 0.4. The two are added to give 7.4 millimetres. A panel sets out the method as two steps: read the main scale just before the vernier zero and never round it up, then find the vernier division that lines up exactly. A note warns to close the jaws first and check for zero error.
The trick is that ten vernier divisions span nine millimetres, so each is 0.9 mm. Only one of them can line up with a main-scale mark, and which one tells you the tenths.
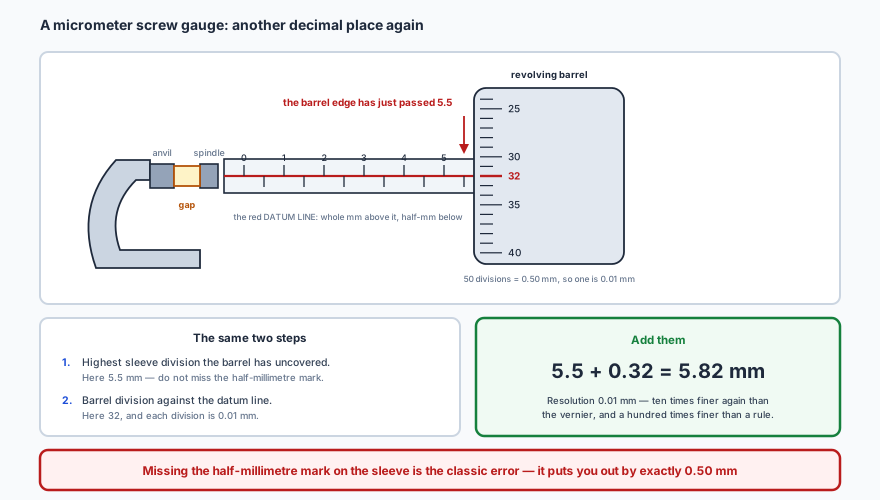
A micrometer screw gauge with an object held between the anvil and the spindle. The sleeve carries a scale with whole millimetres above its red datum line and half-millimetres below, and the revolving barrel has covered it as far as 5.5 millimetres. The barrel carries fifty divisions around its circumference, so each is 0.01 millimetres, and division 32 sits against the datum line. Adding 5.5 and 0.32 gives 5.82 millimetres. A panel gives the same two steps as for the vernier: read the highest sleeve division the barrel has uncovered, then the barrel division against the datum line. A warning notes that missing the half-millimetre mark on the sleeve is the classic error and puts the answer out by exactly 0.50 millimetres.
Same idea, one decimal place further: the screw advances 0.5 mm per turn and the barrel is divided into 50, so one barrel division is 0.01 mm.

✏️Worked example 1 — choosing the instrument, and reading it

You need the diameter of a copper wire, expected to be about 0.4 mm, to better than 2%. (a) Which instrument should you use, and why not the other two? (b) The micrometer sleeve shows 0.5 mm uncovered and the barrel reads 38. What is the diameter?

(a) Compare each instrument's uncertainty against the size of the thing. What matters is the percentage:

metre rule\( \pm 0.5 \) mm on 0.4 mm — over 100%, hopeless
vernier calipers\( \pm 0.05 \) mm on 0.4 mm — about 13%, still far too coarse
micrometer\( \pm 0.01 \) mm on 0.4 mm — about 2.5%, and the only candidate

So the micrometer, and even that is marginal — which is a hint that the diameter should be measured several times, at different points and orientations along the wire, and averaged.

(b) Add the two scales. Sleeve 0.5 mm, barrel \( 38 \times 0.01 = 0.38 \) mm:
\[ d = 0.5 + 0.38 = 0.88\ \text{mm} \]
Sanity check. Hold on — 0.88 mm is more than twice the 0.4 mm expected. Either the wire is not the gauge you thought, or the sleeve reading was misread. This is exactly why an expected value is worth writing down before you measure: it turns a silent mistake into an obvious one. (If the sleeve had shown 0.0 mm and not 0.5, the answer would be 0.38 mm, which is what you were expecting.)
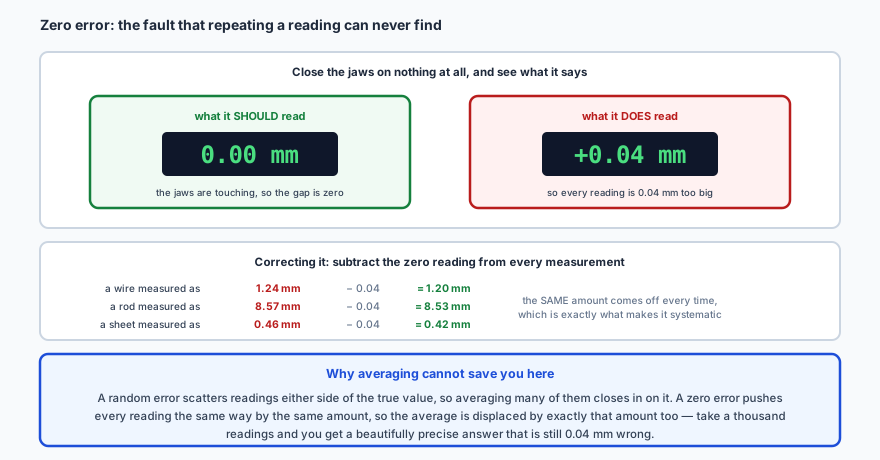
The trap: check the instrument reads zero before you trust it. Close the jaws of the calipers or wind the micrometer shut. If it does not read zero, every measurement you take carries that offset, and no amount of repeating will reveal it — because it is not random. Note the zero reading and subtract it from each result.
An instrument closed on nothing at all should read 0.00 millimetres, but the one shown reads plus 0.04 millimetres, so every reading it gives is 0.04 millimetres too big. A table corrects three measurements by subtracting the same 0.04 from each: 1.24 becomes 1.20, 8.57 becomes 8.53, and 0.46 becomes 0.42, with a note that the same amount comes off every time, which is exactly what makes the error systematic. A panel explains why averaging cannot help: a random error scatters readings either side of the true value so averaging closes in on it, but a zero error displaces every reading the same way by the same amount, so a thousand readings give a beautifully precise answer that is still 0.04 millimetres wrong.
A zero error is the cleanest example of a systematic error, and the easiest to fix — provided you look for it. Averaging is powerless against it.

⚖️Measuring mass

Mass is measured on an electronic top-pan balance. Strictly the balance senses the gravitational pull on the object — a force in newtons — and converts it to a mass using an assumed value of \(g\). That assumption is harmless in a laboratory, and it is the reason a balance must be zeroed before each reading and stood on a level surface.

A balance reading 56.629 g is more precise than one reading 57 g: it offers more significant figures. Whether it is more accurate is a different question entirely, and one it cannot answer about itself — that depends on its calibration.

The most useful technique here solves a problem that looks unsolvable: measuring something far smaller than the balance can resolve.
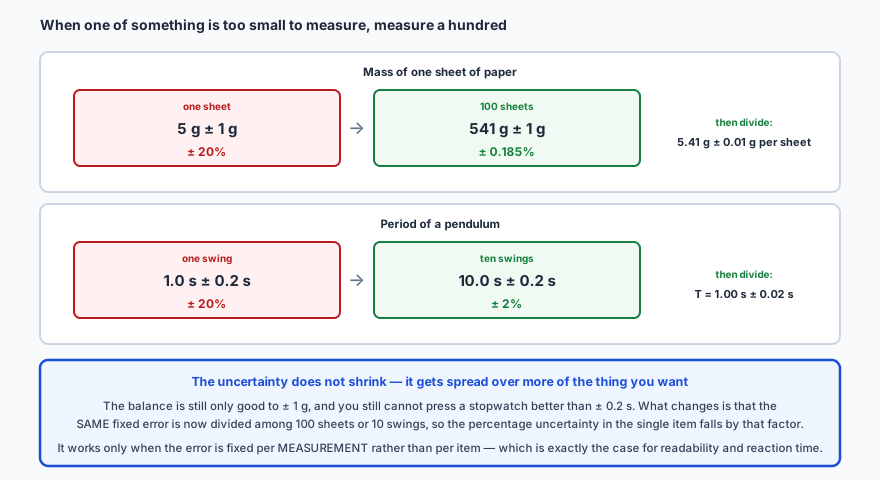
Two examples of measuring many items at once. First, the mass of one sheet of paper: weighing a single sheet gives 5 grams plus or minus 1 gram, an uncertainty of 20 per cent, while weighing 100 sheets gives 541 grams plus or minus 1 gram, an uncertainty of 0.185 per cent, and dividing gives 5.41 grams plus or minus 0.01 grams per sheet. Second, the period of a pendulum: timing one swing gives 1.0 seconds plus or minus 0.2 seconds, again 20 per cent, while timing ten swings gives 10.0 seconds plus or minus the same 0.2 seconds, only 2 per cent, and dividing gives a period of 1.00 seconds plus or minus 0.02 seconds. A panel explains that the uncertainty does not shrink: the balance is still only good to a gram and the stopwatch still cannot be pressed better than 0.2 seconds, but the same fixed error is now spread over a hundred sheets or ten swings.
The error has not got smaller — it has been divided among more of the thing you actually want. That works only because the uncertainty is fixed per measurement, not per sheet.

✏️Worked example 2 — the mass of a single drawing pin

A balance reads to the nearest 0.1 g. A single drawing pin registers 0.3 g. A box of 250 of them, tipped onto the pan, registers 77.4 g. Find the mass of one pin, with its uncertainty, both ways, and compare.

Weighing one pin. The balance's last digit is 0.1 g, so

\[ m = 0.3 \pm 0.1\ \text{g}, \qquad \frac{0.1}{0.3} \times 100 = 33\% \]

Weighing 250 pins. The reading is 77.4 g with the same ± 0.1 g, because it is one reading on the same balance:

\[ m_{250} = 77.4 \pm 0.1\ \text{g}, \qquad \frac{0.1}{77.4} \times 100 = 0.13\% \]

Dividing by 250 divides the value and the absolute uncertainty alike, and leaves the percentage untouched:

\[ m = \frac{77.4}{250} = 0.3096\ \text{g}, \qquad \Delta m = \frac{0.1}{250} = 0.0004\ \text{g} \]
\[ m = 0.3096 \pm 0.0004\ \text{g} \]
Sanity check. The two answers agree — 0.3096 sits comfortably inside \( 0.3 \pm 0.1 \) — but the second is nearly three hundred times better determined, from the same balance and one extra weighing. Note also that this only works if the pins really are identical; if the box contains a few bent ones, you have measured a mean rather than a value, and should say so.

⏱️Measuring time

A stopwatch displays hundredths of a second and is nothing like that good, because a human sits between the event and the button. Reaction time is around 0.2 s, and it enters twice — once starting, once stopping.
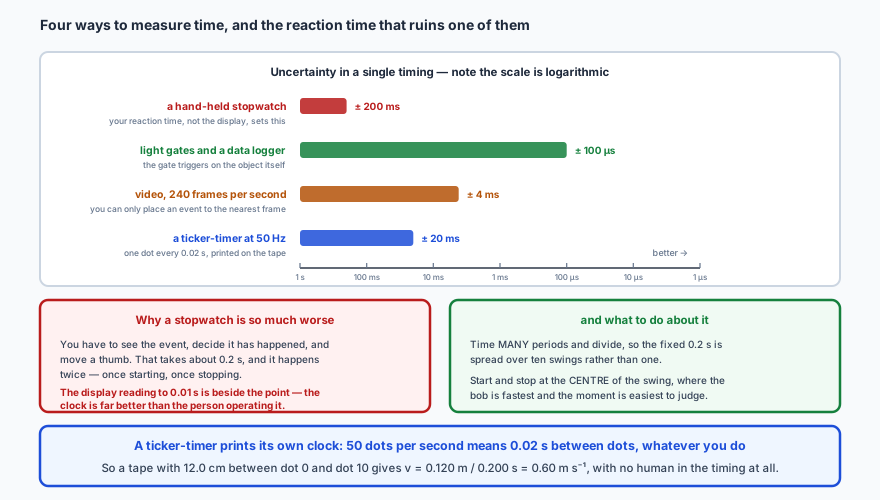
A logarithmic comparison of the uncertainty in a single timing by four methods. A hand-held stopwatch is plus or minus 200 milliseconds, set by reaction time rather than by the display. A ticker-timer at 50 hertz gives plus or minus 20 milliseconds, printed on the tape. Video at 240 frames per second gives about 4 milliseconds, since an event can only be placed to the nearest frame. Light gates with a data logger reach 100 microseconds, because the gate triggers on the object itself. Two panels follow: one explaining that a stopwatch is worse because you must see the event, decide it has happened and move a thumb, twice over; the other suggesting timing many periods and dividing, and starting and stopping at the centre of a swing where the bob moves fastest.
Note the axis is logarithmic: a light gate is not a little better than a thumb, it is about two thousand times better. Anything that takes the human out of the timing is worth doing.

✏️Worked example 3 — timing a pendulum properly

A pendulum has a period of about 1.4 s. A student times 20 complete swings and gets 28.3 s. Taking the uncertainty in any single stopwatch timing as ± 0.2 s, find the period and its percentage uncertainty, and compare with timing one swing.

The measured interval. One reading, so one uncertainty:

\[ 20T = 28.3 \pm 0.2\ \text{s} \]

Divide by 20. Value and absolute uncertainty both divide:

\[ T = \frac{28.3}{20} = 1.415\ \text{s}, \qquad \Delta T = \frac{0.2}{20} = 0.01\ \text{s} \]
\[ T = 1.41 \pm 0.01\ \text{s} \qquad (0.7\%) \]

Against timing one swing: \( 1.4 \pm 0.2 \) s, which is 14% — twenty times worse, for the same stopwatch and the same student.

Sanity check. The percentage uncertainty fell by exactly the factor of 20 we divided by, which is the point of the technique. Two practical notes: count “zero” on the first swing rather than “one”, or you will time 19 swings and call it 20; and start the watch as the bob passes through the centre, where it is moving fastest and the instant is sharpest, not at the end of the swing where it hangs.

🧪Measuring volume

A regular shape can be measured and its volume calculated. An irregular one is submerged, and the water it displaces is its volume.
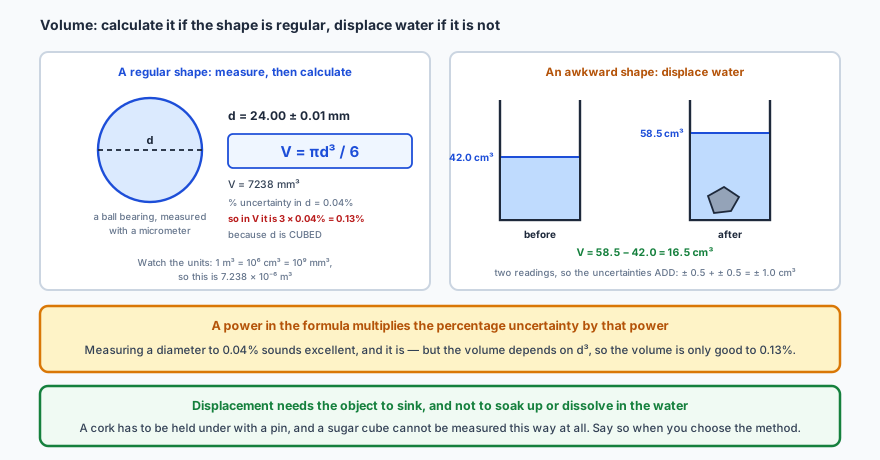
On the left, finding the volume of a regular shape by calculation: a ball bearing measured with a micrometer gives a diameter of 24.00 plus or minus 0.01 millimetres, and the formula V equals pi d cubed over 6 gives 7238 cubic millimetres. Because the diameter is cubed, its 0.04 per cent uncertainty becomes 0.13 per cent in the volume. A note on units records that one cubic metre is a million cubic centimetres or a thousand million cubic millimetres. On the right, finding the volume of an awkward shape by displacement: a measuring cylinder reads 42.0 cubic centimetres before the object is lowered in and 58.5 after, so the volume is 16.5 cubic centimetres, and because two readings are involved their uncertainties add to give plus or minus 1.0 cubic centimetres.
Two readings mean two uncertainties, and for a subtraction the absolute uncertainties add. That is why a small displacement measured between two large volumes is such a poor measurement.

Measuring current and potential difference

An ammeter measures the current through a component, so it must be placed where that current flows: in series. A voltmeter measures the potential difference across a component, between two points, so it goes in parallel with it.
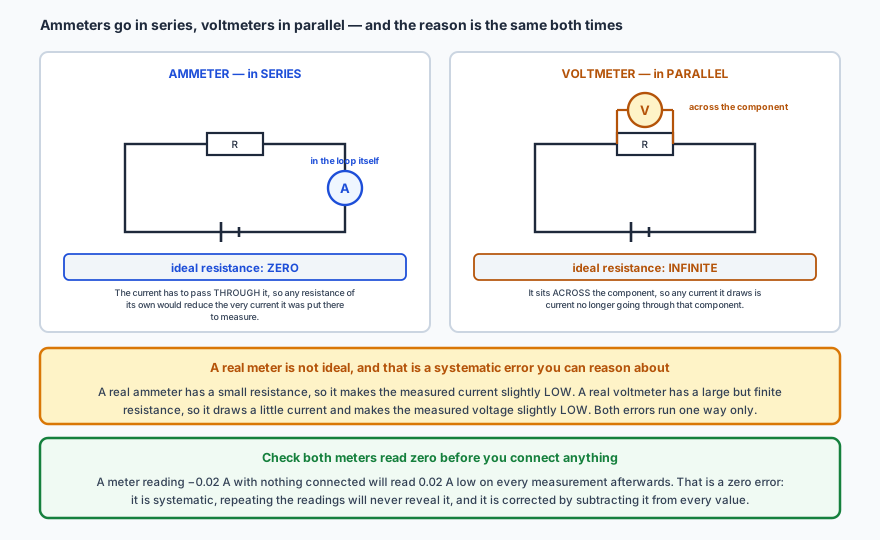
Two circuit diagrams. On the left an ammeter sits in the loop itself, in series with a resistor and a cell, and its ideal resistance is zero, because the current has to pass through it and any resistance of its own would reduce the very current it was put there to measure. On the right a voltmeter is connected across the resistor, in parallel, and its ideal resistance is infinite, because any current it draws is current no longer going through the component. Two notes follow: that a real ammeter has a small resistance and a real voltmeter a finite one, so both make their readings slightly low in a way that runs one direction only; and that both meters should be checked to read zero before anything is connected, since a meter reading minus 0.02 amperes with nothing connected will read 0.02 low on every measurement afterwards.
Both ideal resistances follow from the same requirement: the meter must not change the thing it is measuring. A perfect ammeter would drop no voltage; a perfect voltmeter would draw no current.
The trap: the voltmeter is the one resistance you do not want to reduce. Most of this topic is about minimising stray resistance — in leads, in contacts, in the ammeter. The voltmeter runs the other way: the larger its resistance the better, because the current it steals is current that never went through the component. Writing that a voltmeter should have low resistance “so it does not affect the circuit” gets the reasoning exactly backwards.

🌡️Temperature, force and angle

Every thermometer works by measuring something else that changes with temperature, then converting. A liquid-in-glass thermometer uses the expansion of a liquid relative to its glass; a resistance thermometer uses the resistance of a platinum wire; a thermocouple uses the emf across a junction of two different metals; a pyrometer uses the radiation a hot body emits, which is the only one of the four that needs no contact at all. Each is calibrated against fixed points — conventionally the freezing and boiling points of pure water.

Force is measured with a spring, using Hooke's law, or with an electronic force sensor. The sensor is the better choice whenever the force is changing quickly, as in a collision, because it can be logged continuously. Angle is measured with a protractor, or — often more accurately — by measuring two lengths and taking an inverse tangent, which sidesteps the difficulty of aligning a protractor with anything.

🔊Sound and light intensity

Intensity is the power arriving per unit area, in W m−2, and for any wave it depends on the square of the amplitude — so doubling the amplitude quadruples the intensity.
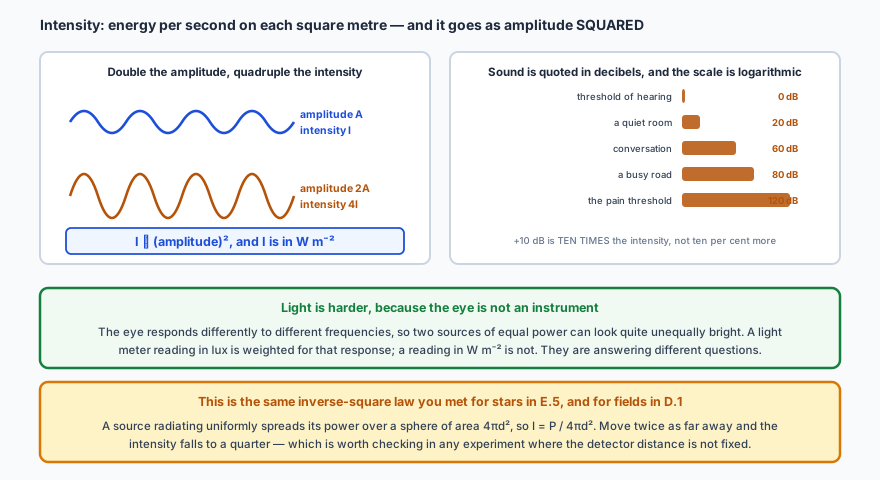
On the left, two waves of the same wavelength: one of amplitude A carrying intensity I, and one of amplitude 2A carrying intensity 4I, illustrating that intensity is proportional to amplitude squared and is measured in watts per square metre. On the right, a bar chart of typical sound intensity levels in decibels: the threshold of hearing at 0 decibels for an intensity of ten to the minus twelve watts per square metre, a quiet room at 20, conversation at 60, a busy road at 80 and the pain threshold at 120, with a note that adding ten decibels means ten times the intensity rather than ten per cent more. Two further panels note that light is harder to measure because the eye responds differently to different frequencies, so a light meter reading in lux is weighted for that response while one reading in watts per square metre is not, and that intensity follows the same inverse-square law met for stars and for fields.
The decibel scale is logarithmic and referenced to \( 10^{-12} \) W m−2, the quietest sound a person can hear. That is why the numbers stay manageable across a range of \( 10^{12} \).

✏️Worked example 4 — picking instruments for a real investigation

You are investigating how the resistance of a wire depends on its length. State what you would measure, with what, and give the uncertainty in each — then say which measurement limits the result.

Length of wire — metre rule, ± 1 mm (two ends, each ± 0.5 mm). Over a length of 0.500 m that is 0.2%.

Diameter of wire — micrometer, ± 0.01 mm, repeated at several points and averaged. On 0.38 mm that is 2.6%, and since the cross-sectional area goes as \(d^2\) it becomes 5.2% in the area.

Current — ammeter in series, ± 0.01 A on perhaps 0.25 A: 4%.

Potential difference — voltmeter in parallel, ± 0.01 V on perhaps 1.50 V: 0.7%.

Which one limits it? The diameter, by a wide margin — not because the micrometer is poor, but because the wire is thin and the diameter is squared. That single observation tells you where to spend your effort: a thicker wire, or more repeat measurements of the diameter, will improve the experiment. Buying a better voltmeter will not. Identifying the dominant uncertainty, rather than listing all of them, is what an evaluation is for — and it is picked up again in I.3.

📝Practise

Work through these, then reveal the answer. Each question targets a different objective from the list above.

1. State the uncertainty you would quote for each of these, and say which rule you used: (a) a metre rule with 1 mm divisions; (b) a digital balance displaying 12.48 g; (c) a protractor with 1° divisions; (d) a stopwatch displaying 9.61 s, pressed by hand.
(a) ± 0.5 mm — analogue, so half the smallest division.
(b) ± 0.01 g — digital, so the whole last digit.
(c) ± 0.5° — analogue, half a division.
(d) ± 0.2 s, not ± 0.01 s. The display's readability is 0.01 s, but human reaction time enters twice and swamps it. Always quote the largest uncertainty present in the measurement, not the one the instrument advertises.
2. Vernier calipers show the vernier zero lying between the 4 and 5 mm marks, with vernier division 7 lining up exactly with a main-scale mark. What is the reading?
Whole millimetres from the main scale, read before the vernier zero: 4 mm.
Tenths from the vernier division that coincides: \( 7 \times 0.1 = 0.7 \) mm.
Reading = \( 4 + 0.7 = 4.7 \) mm.
The commonest error is rounding the main scale up to 5 because the zero is closer to it. It is the mark before the vernier zero that counts, always.
3. A micrometer shows 12.0 mm uncovered on the sleeve and its barrel reads 47. What is the measurement? What would it have been if the half-millimetre mark had also been uncovered and you had missed it?
\( 12.0 + 47 \times 0.01 = 12.0 + 0.47 = 12.47 \) mm.
Had the 12.5 mm half-millimetre mark also been showing, the true reading would be \( 12.5 + 0.47 = 12.97 \) mm — exactly 0.50 mm more. That is why the half-millimetre marks below the datum line have to be checked deliberately: missing one does not produce a slightly wrong answer, it produces one wrong by a specific, and quite large, amount.
4. A micrometer reads −0.03 mm when wound fully closed. A student then measures a rod as 4.62 mm. What is the true diameter, and why would repeating the measurement ten times not have helped?
The instrument reads 0.03 mm low, so every reading must have 0.03 mm added back: \[ d = 4.62 - (-0.03) = 4.65\ \text{mm} \] Repeating does not help because a zero error is systematic: it shifts every reading in the same direction by the same amount. Averaging reduces random scatter, which lies on both sides of the true value, so it converges on the truth. Here all ten readings would be 0.03 mm low, and so would their mean — a precise answer that is still wrong.
5. A balance reads to ± 1 g. A stack of 50 identical sheets of card has a mass of 231 g. Find the mass of one sheet with its uncertainty, and compare the percentage uncertainty with weighing a single sheet.
\( m = 231/50 = 4.62 \) g and \( \Delta m = 1/50 = 0.02 \) g, so \( m = 4.62 \pm 0.02 \) g.
Percentage uncertainty: \( (1/231) \times 100 = 0.43\% \), unchanged by the division.
Weighing one sheet would give \( 5 \pm 1 \) g, or 20% — roughly fifty times worse. The balance is no better in the second case; the same ± 1 g is simply shared among 50 sheets.
6. A student times 25 complete swings of a pendulum as 41.2 s, taking ± 0.2 s as the uncertainty in the timing. Find the period and its percentage uncertainty.
\( T = 41.2/25 = 1.648 \) s and \( \Delta T = 0.2/25 = 0.008 \) s, so \( T = 1.648 \pm 0.008 \) s.
Percentage uncertainty: \( (0.2/41.2) \times 100 = 0.49\% \), or about 0.5%.
Note that it is the total time that carries the ± 0.2 s, not each swing — there is only one start and one stop, however many swings happen in between. That is precisely why the technique works.
7. A measuring cylinder reads 18.0 cm³ before an irregular object is lowered in and 26.5 cm³ after. Each reading is ± 0.5 cm³. Find the volume with its uncertainty, and state two conditions the object must satisfy.
\( V = 26.5 - 18.0 = 8.5 \) cm³.
For a subtraction the absolute uncertainties add: \( \Delta V = 0.5 + 0.5 = 1.0 \) cm³. So \( V = 8.5 \pm 1.0 \) cm³, which is a hefty 12%.
The object must sink (or be held under, which then displaces the volume of the pin too) and must not absorb or dissolve in the water. Note how poor this measurement is: two large readings subtracted to give a small difference is always a bad arrangement, because the uncertainties do not shrink with the answer.
8. A ball bearing has a diameter of 12.00 ± 0.01 mm. Find its volume and the percentage uncertainty in that volume.
\( V = \pi d^{3}/6 = \pi (12.00)^{3}/6 = 905 \) mm³.
Percentage uncertainty in \(d\): \( (0.01/12.00) \times 100 = 0.083\% \).
Because \(d\) is cubed, the percentage uncertainty is multiplied by three: \[ \frac{\Delta V}{V} = 3 \times 0.083\% = 0.25\% \] so \( V = 905 \pm 2 \) mm³. A power in the formula always multiplies the percentage uncertainty by that power — which is why the quantity that is raised to the highest power usually deserves the most careful measurement.
9. Explain why an ammeter should ideally have zero resistance and a voltmeter infinite resistance. What does each fall short of ideal do to the reading?
An ammeter is placed in series, so the current it is measuring passes through it. Any resistance of its own adds to the circuit's total resistance and therefore reduces the current — the very quantity it is reporting. Ideally that resistance is zero. A real ammeter has a small resistance, so its reading is slightly low.

A voltmeter is placed in parallel with the component. Any current it draws is current that is no longer flowing through the component, which reduces the potential difference across it. Ideally its resistance is infinite so it draws none. A real voltmeter has a large but finite resistance, so its reading is also slightly low.

Both are systematic errors, and both run in one direction only — which means they can be reasoned about and, if the meter resistances are known, corrected for.
10. A sound is measured at 40 dB. Given that 0 dB corresponds to \( 1 \times 10^{-12} \) W m−2, find its intensity. If the amplitude of the wave were tripled, by what factor would the intensity change?
The decibel scale is logarithmic, with every 10 dB representing a factor of ten in intensity. 40 dB is four such steps: \[ I = 10^{-12} \times 10^{4} = 1 \times 10^{-8}\ \text{W m}^{-2} \] Tripling the amplitude: intensity is proportional to amplitude squared, so the intensity rises by a factor of \( 3^{2} = 9 \).
Both parts test the same habit — checking whether a relationship is linear, squared or logarithmic before doing any arithmetic. Reading 40 dB as “four times” the threshold rather than ten thousand times is the error to avoid.

🔗Go deeper — other people’s work

These are external resources, not mine. If one stops working, tell me and everything above it on this page still stands.

  • PhET — the vernier and micrometer practice simulators, for reading scales until it is automatic
  • NPL’s Good Practice Guide to measurement, for what calibration means outside a school lab