Kinematics
Kinematics describes motion without asking what caused it. Five quantities — \(u\), \(v\), \(a\), \(t\), \(s\) — three graphs, and one rule that horizontal and vertical motion are independent. Nearly every mark lost here is lost to bookkeeping rather than to physics: a scalar used where a vector was needed, an equation used where the acceleration was not constant, or a launch speed substituted where a component belonged.
🎯What you need to be able to do
- Distinguish distance from displacement and speed from velocity, and say why the distinction matters.
- Work with average and instantaneous speed, velocity and acceleration — and know when the two differ.
- Read and sketch the three motion graphs: what a gradient means, what an area means, and how they connect.
- Use the equations of motion for uniformly accelerated motion, and recognise the situations where they do not apply.
- Describe how motion is recorded in the laboratory: light gates, ticker tape, strobe photography, video and data loggers.
- Analyse free fall, and describe an experiment to determine \(g\) from a graph rather than from a single reading.
- Analyse projectile motion by treating the horizontal and vertical components separately.
- Describe qualitatively the effect of fluid resistance on falling objects and on projectiles, including terminal speed.
🧭Describing motion
Four technical terms carry the whole topic, and none of them means quite what it means in everyday speech. Learn each one with its vector-or-scalar label attached — that label is the part that gets tested.
- Displacement, \(s\) — the change in position: the distance moved in a particular direction. Unit: m. Vector. The displacement from Jakarta to Denpasar is about \(9.6 \times 10^{5}\) m east, whatever route the aircraft actually flew.
- Velocity, \(v\) or \(u\) — the rate of change of displacement, \(\text{velocity} = \dfrac{\text{change of displacement}}{\text{time taken}}\). Unit: m s\(^{-1}\). Vector.
- Speed, \(v\) or \(u\) — the rate of change of distance, \(\text{speed} = \dfrac{\text{distance travelled}}{\text{time taken}}\). Unit: m s\(^{-1}\). Scalar.
- Acceleration, \(a\) — the rate of change of velocity, \(a = \dfrac{\Delta v}{\Delta t}\). Its unit follows from that definition: (m s\(^{-1}\)) ÷ s = m s\(^{-2}\). Vector.
Distance and displacement. Distance is how far you travelled. Displacement is how far you ended up from where you started, together with the direction. Run one lap of a 400 m track and your distance is 400 m while your displacement is zero. Almost every avoidable kinematics error starts with treating one as the other.
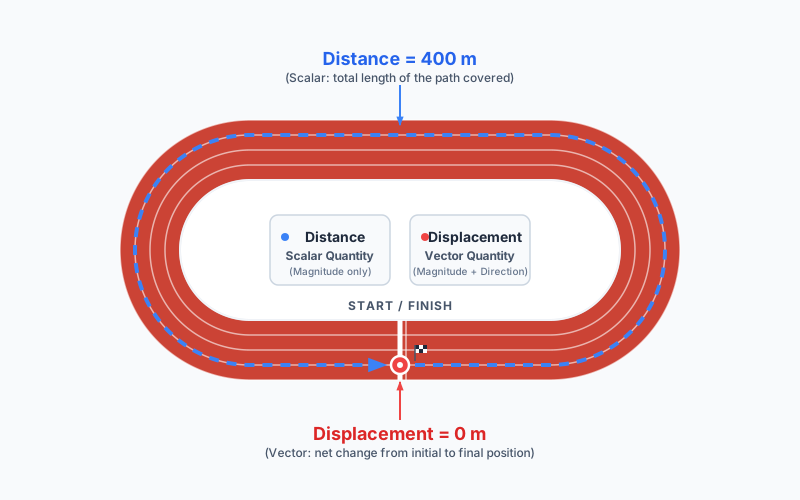
Speed is built from distance, so speed is a scalar. Velocity is built from displacement, so velocity is a vector. On that lap your average speed was respectable and your average velocity was exactly zero. The two words are interchangeable only when the motion is in a straight line and never reverses — which is precisely the case textbooks introduce first, and precisely why the distinction feels invented until the first question that breaks it.
Acceleration is stranger than it looks. It is defined through velocity, not speed, and that has two consequences that catch people out every year.
⏱️Average and instantaneous
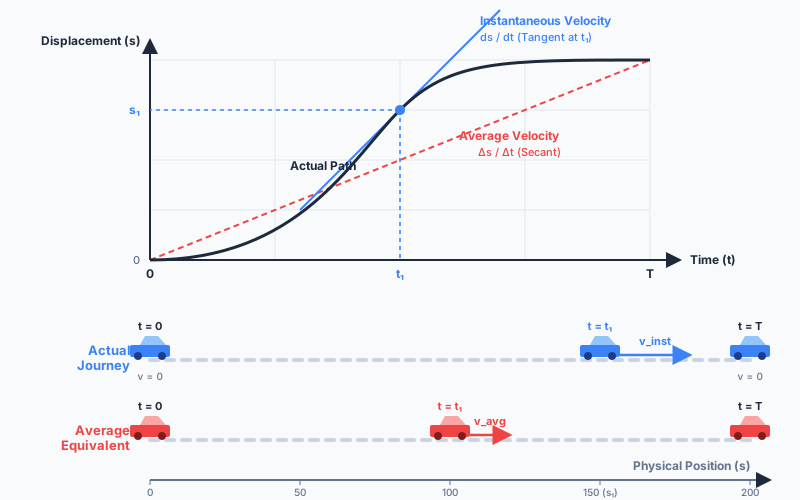
An average value covers a period of time; an instantaneous value belongs to one moment. Average velocity is total displacement divided by total time. Instantaneous velocity is what a speedometer reads — the gradient of the displacement–time graph at a single point.
A sprinter runs 100 m in 11.3 s, so her average speed for the race is \(100/11.3 = 8.85\) m s\(^{-1}\). Over the first 2.0 s she covers only 10.04 m, an average of 5.02 m s\(^{-1}\) for that interval. She started from rest and was speeding up throughout, so her instantaneous speed at \(t = 2.0\) s must be greater than 5.02 m s\(^{-1}\) — but nothing in those numbers tells you what it actually was. Averages hide the detail; that is what they are for.
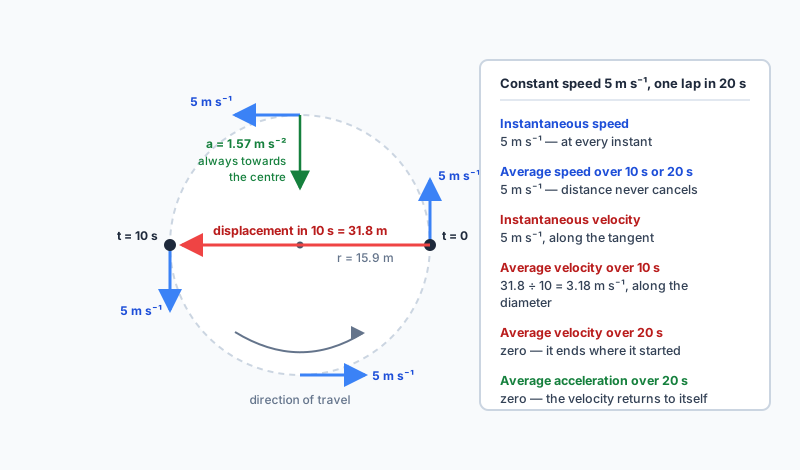
Averaging vectors is not averaging numbers. Take an object moving at a constant 5 m s\(^{-1}\) around a horizontal circle of radius 15.9 m, one lap every 20 s. Its speed — instantaneous, or averaged over any interval you like — is 5 m s\(^{-1}\), because distance never cancels. Its velocity is a different story.
📈Motion graphs
Three graphs describe any motion, and there are only two things you ever do with them: find a gradient, or find an area. The gradient of a straight section gives an average value; the gradient of the tangent at one point gives an instantaneous one.
gradient = velocity
the area means nothing
gradient = acceleration
area = displacement
gradient rarely useful
area = change in velocity
Remember it as gradient going down the list, area coming back up, and you can move freely between all three. The figure below is one journey drawn all three ways: 4.0 s of uniform acceleration at 5.0 m s\(^{-2}\), 2.0 s at a steady 20 m s\(^{-1}\), then 2.0 s of braking at 10 m s\(^{-2}\).
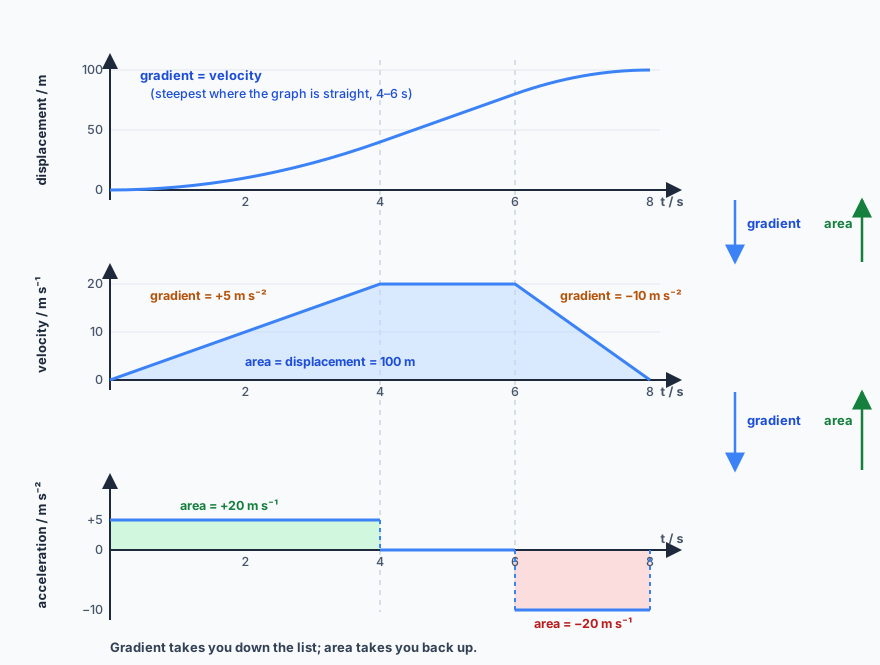
Areas are signed. Area below the time axis on a velocity–time graph is negative displacement and subtracts from what came before, which is how a graph can show a body ending exactly where it started. On the acceleration–time graph above, the two areas are \(+20\) and \(-20\) m s\(^{-1}\) — which is precisely the story of a velocity that climbs to 20 m s\(^{-1}\) and comes back to zero.
Because these graphs handle one direction at a time, you must choose which direction is positive and label it. It does not matter which you choose. It matters enormously that you keep to it.
🧮The equations of uniformly accelerated motion
These five equations link the five quantities \(u\) (initial velocity), \(v\) (final velocity), \(a\) (constant acceleration), \(t\) (time taken) and \(s\) (displacement). They hold only when the acceleration is constant. Check that condition before writing anything down.
Each connects four of the five quantities, so each is missing one: the first has no \(s\), the second no \(a\), the third no \(v\), the fourth no \(t\), the fifth no \(u\). List what you know, mark what you want with a question mark, and pick the equation that omits the quantity you neither know nor need.
Where they come from. Only the first two are worth deriving; the rest follow by substitution. The definition of acceleration, \(a = \dfrac{v-u}{t}\), rearranges straight into \(v = u + at\). And average velocity is \(s/t\), while for uniformly changing velocity that average is also the mean of the two end values, \(\dfrac{u+v}{2}\). So
Substituting \(v = u + at\) into that gives \(s = ut + \tfrac{1}{2}at^{2}\); eliminating \(t\) instead gives \(v^{2} = u^{2} + 2as\). Being able to rebuild the set from those two definitions is a better insurance policy than memorising all five.
✏️Worked example 1 — straight-line acceleration
List first. \(u = 0\) (“from rest”), \(t = 8.0\) s, \(s = 120\) m, \(a = ?\), \(v = ?\). Part (a) needs an equation linking \(u\), \(a\), \(t\) and \(s\) — the one with no \(v\):
Part (b) needs one linking \(u\), \(v\), \(a\) and \(s\) — the one with no \(t\):
🔬Measuring motion in the laboratory
Every measurement of velocity or acceleration comes down to recording a distance and the time taken to cover it. The methods differ in how much of the motion they capture, and in how much apparatus stands between you and the object.
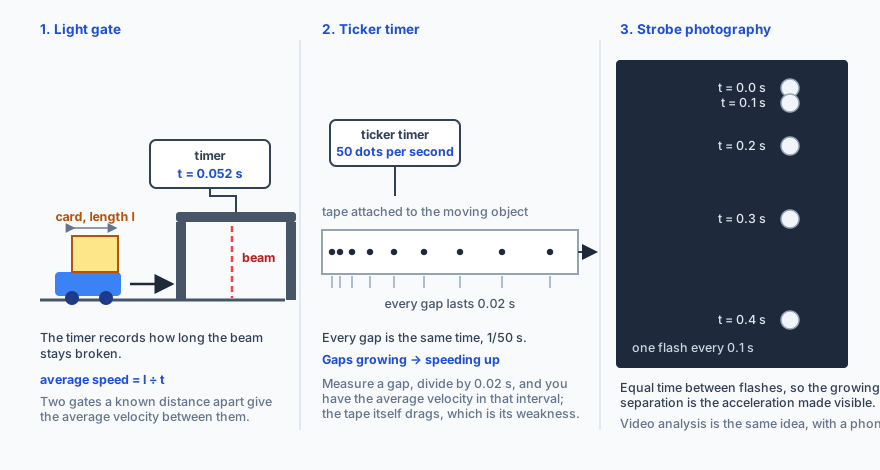
- Light gates. The gate times how long its beam stays broken. A card of known length \(l\) breaking the beam for a time \(t\) gives an average speed \(l/t\) through the gate — and the shorter the card, the closer that comes to an instantaneous value. Two gates a known distance apart give the average velocity between them; several gates and a computer give the acceleration directly.
- Ticker timer. A tape attached to the object is printed with dots at a fixed rate, typically 50 per second, so every gap represents 0.02 s. Measure a gap, divide by 0.02 s, and you have the average velocity during that interval; gaps that grow mean the object is speeding up. The whole motion is recorded, not just its total — that is the method's strength. The friction of the tape is its weakness.
- Strobe photography. In a darkened room, a flash at fixed intervals captures several positions on one frame. The times between flashes are equal, so the growing separations are the acceleration, made visible.
- Data loggers and video analysis. A distance sensor logging automatically, or a video stepped through frame by frame against a metre rule, gives many precise readings quickly. The trade is that more technology makes systematic errors easier to hide: an instrument that is wrong in the same way every time still produces a beautifully smooth graph.
🍎Falling objects and free fall
Free fall is motion under gravity alone, with air resistance ignored. It is the most important example of uniform acceleration, because close to the Earth's surface \(g\) is constant at about 9.81 m s\(^{-2}\) — and, crucially, the same for every object whatever its mass. A hammer and a feather released together in a vacuum land together.
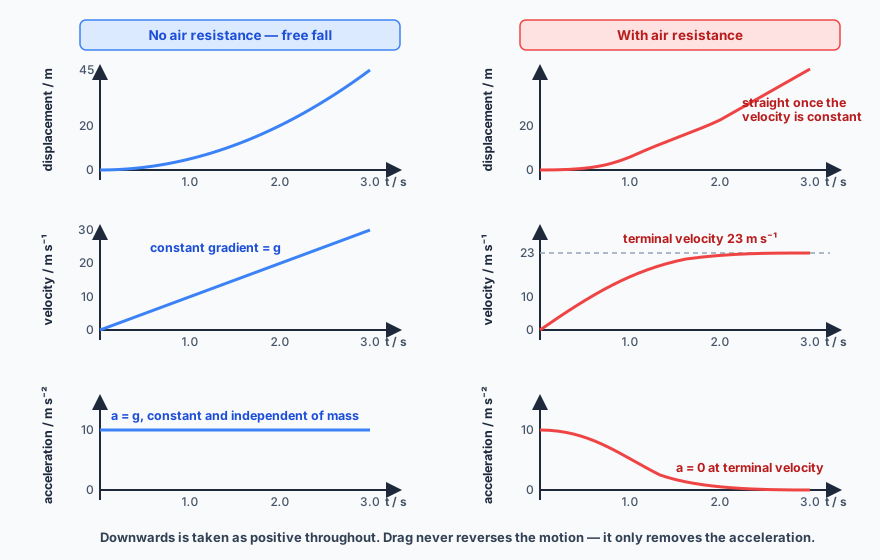
With air resistance the story changes. Drag grows with speed, so as the object accelerates the resultant force (weight minus drag) shrinks and the acceleration falls with it. The object is still speeding up, just less and less quickly. When drag equals weight the resultant is zero, the acceleration is zero, and the speed stops changing: terminal velocity. On a velocity–time graph that is a curve flattening smoothly towards a horizontal asymptote — never a straight line that suddenly bends over. A sheet of paper reaches its terminal velocity in a fraction of the time a falling book takes.
Determining \(g\) experimentally
Every method rests on the same equation. An object released from rest and falling a height \(h\) in a time \(t\) obeys
You could stop there and compute one value from one pair of readings. Don't. Time the fall from several different heights and plot \(h\) against \(t^{2}\): the result should be a straight line through the origin of gradient \(\tfrac{1}{2}g\), so \(g\) is twice the gradient.
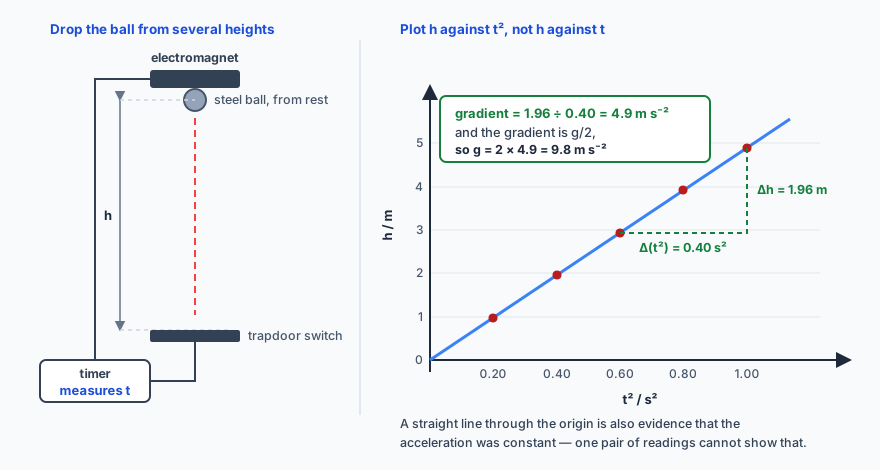
That is not merely a tidier way of presenting the same number. A straight line through the origin is evidence that the acceleration was constant, which no single pair of readings can give you, and the gradient averages the random error of every reading at once. Choose apparatus with the same scepticism. A ball bearing, a stopwatch and a metre rule are crude but can be repeated dozens of times, so random error can be beaten down; an electromagnet with electronic timing is far more precise per reading and far better at concealing a systematic error inside itself. Ticker tape records the whole fall for graphical analysis but adds friction; a data logger automates everything and demands that you understand what the software is doing.
🏹Projectile motion
A projectile is an object moving under gravity alone once it has been launched, and its path is a parabola. The entire topic rests on one idea: the horizontal and vertical components of the motion are independent, and time is the only quantity they share.
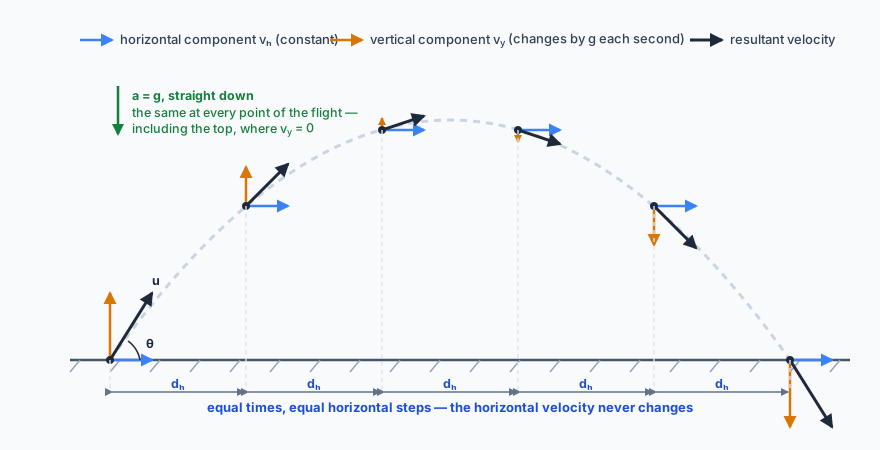
Horizontally there is no force (air resistance ignored), so there is no acceleration and the horizontal velocity never changes: \(x = u_x t\). Vertically there is a constant force, the weight, so there is a constant acceleration \(g\) downwards — at every point of the flight, including the highest point, where the vertical velocity is zero but the acceleration certainly is not. Drawn as graphs, the two columns could hardly look less alike.
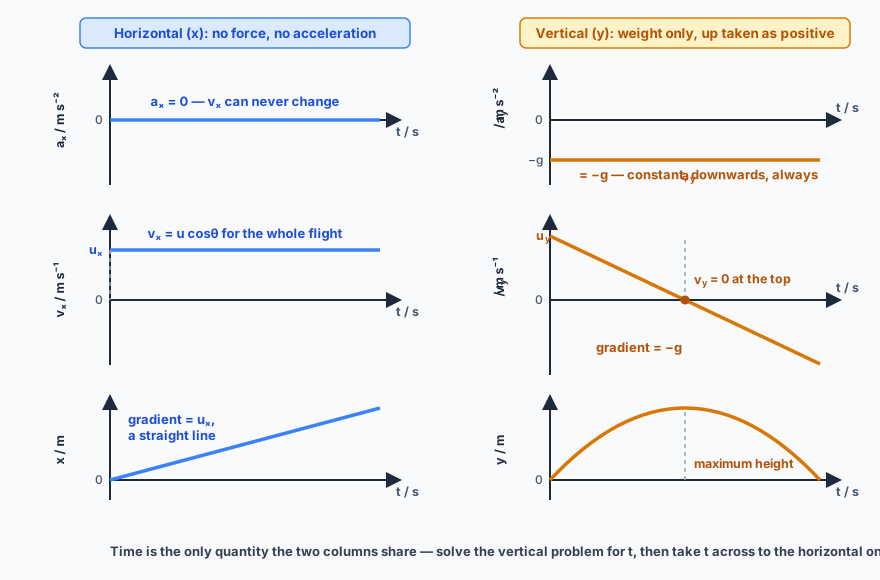
So the method for every projectile question is the same:
- Resolve the launch velocity into components: \(u_x = u\cos\theta\) and \(u_y = u\sin\theta\).
- Choose a positive direction for the vertical and keep to it.
- Do the vertical problem with the equations of motion — it is what fixes the time of flight.
- Carry that time across to the horizontal, where the only equation you need is \(x = u_x t\).
- If you need the velocity at some instant, recombine the components by vector addition.
Three shortcuts are worth taking into the exam. For a given launch speed on level ground the greatest range comes at \(45^\circ\). Two launch angles adding to \(90^\circ\) give the same range. And an object projected horizontally reaches the ground at the same moment as one simply dropped from the same height, because their vertical motions are identical.
For a launch from level ground at speed \(u\) and angle \(\theta\), the time of flight follows from the vertical displacement being zero, \(t = \dfrac{2u\sin\theta}{g}\), and substituting that into \(R = u\cos\theta \times t\) gives the range:
which makes the first two shortcuts obvious: \(\sin 2\theta\) is largest at \(\theta = 45^\circ\), and \(\sin 2\theta\) is unchanged when \(\theta\) is replaced by \(90^\circ - \theta\).
✏️Worked example 2 — a projectile
Resolve first. \( u_x = 18\cos 35^\circ = 14.7 \) m s\(^{-1}\) and \( u_y = 18\sin 35^\circ = 10.3 \) m s\(^{-1}\). From this point on the figure 18 never appears again, and that discipline is what the whole question rests on.
(a) Time of flight is a vertical question. The ball lands at the height it left, so its vertical displacement over the whole flight is zero. Putting \(s = 0\), \(u = 10.3\) and \(a = -9.81\) into \( s = ut + \tfrac{1}{2}at^{2} \) gives \( 0 = t(10.3 - 4.905t) \), so
(b) Range is a horizontal question, and the horizontal velocity is constant: \( x = 14.7 \times 2.10 = 31 \) m.
(c) At the highest point the vertical velocity is zero, so \( v^{2} = u^{2} + 2as \) applied vertically with \(v = 0\) gives
💨Fluid resistance
A fluid is a liquid or a gas, and anything moving through one feels a resistive force. Modelling it properly is hard, but three facts carry this course: viscous drag always acts opposite to the velocity, it grows with the speed of the object relative to the fluid, and it depends on the object's size and shape and on the viscosity of the fluid itself.
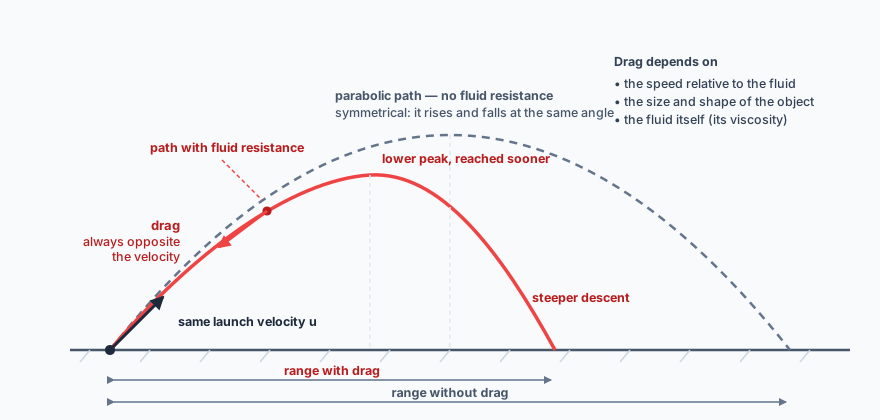
For a projectile, drag reduces both components of the velocity, so the range shrinks and the parabola's symmetry is destroyed: the descent is steeper than the ascent, and in the extreme case the horizontal velocity falls almost to zero and the object drops nearly vertically at the end. For a falling object, drag is what produces terminal velocity. Both are the same effect seen from two angles — a force that opposes motion and grows with speed can never reverse the motion, only remove the acceleration.
🔭See it happen
PhET, Projectile Motion. Three things worth doing rather than just firing the cannon. Launch at 30° and then at 60° with the same speed and watch the ranges come out identical, because angles adding to 90° always give the same range on level ground. Fire one projectile horizontally while dropping another from the same height, and watch them land together. Then switch air resistance on and watch every one of those symmetries break.
📝Practise
Work through these, then reveal the answer. Between them they cover every objective at the top of the page. Take \(g = 9.81\) m s\(^{-2}\) throughout.
1. A car accelerates uniformly from 12 m s\(^{-1}\) to 30 m s\(^{-1}\) in 6.0 s. Find its acceleration and the distance travelled.
2. A pupil cycles uphill from home to school at 5.0 m s\(^{-1}\) and back down the same road at 10 m s\(^{-1}\). (a) Find the average speed for the whole journey. (b) Explain why it is not 7.5 m s\(^{-1}\). (c) State the average velocity.
(a) Let each leg be a distance \(d\). Time up \(= d/5.0\), time down \(= d/10\), total \(= 0.30d\). Total distance \(= 2d\), so the average speed is \(2d / 0.30d = 6.7\) m s\(^{-1}\).
(b) Because average speed is total distance over total time, and the pupil spends twice as long on the slow leg as on the fast one. Averaging the two speeds would be right only if equal times were spent at each, not equal distances.
(c) Zero. The pupil ends where they started, so the displacement — and therefore the average velocity — is zero.
3. A velocity–time graph shows the velocity rising in a straight line from 0 to 20 m s\(^{-1}\) over 5.0 s, then staying constant at 20 m s\(^{-1}\) for a further 3.0 s. Find the acceleration in the first phase and the total displacement.
4. A stone is dropped from rest and falls 45 m. Find the time of fall and the speed on impact.
5. A research rocket is launched vertically from rest with a uniform acceleration of 110 m s\(^{-2}\) for 6.0 s, until its fuel runs out. It then rises freely before falling back. Assume \(g\) stays constant and ignore air resistance. Find (a) its maximum speed, (b) the maximum height reached, (c) the time taken to reach that height.
(a) The speed is greatest at burnout: \(v = at = 110 \times 6.0 = 660\) m s\(^{-1}\).
(b) Two phases, handled separately. Powered: \(s_1 = \tfrac{1}{2}(110)(6.0)^{2} = 1980\) m. Free rise from 660 m s\(^{-1}\) to rest: \(s_2 = \dfrac{660^{2}}{2 \times 9.81} = 2.22 \times 10^{4}\) m. Total \(\approx 2.4 \times 10^{4}\) m, about 24 km.
(c) \(t = 6.0 + \dfrac{660}{9.81} = 6.0 + 67.3 = 73\) s. The acceleration is not constant across the whole flight, so no single equation of motion covers it — splitting the problem at burnout is the whole technique.
6. A bullet leaves a gun horizontally at 300 m s\(^{-1}\) from 1.50 m above the ground; air resistance is negligible. (a) The gun is aimed straight at the centre of a target 50.0 m away. How far below the centre does the bullet arrive? (b) With the target removed, how long before the bullet hits the ground? (c) A second bullet is dropped from the muzzle at the instant the first is fired. Which lands first?
(a) Horizontally, \(t = 50.0/300 = 0.167\) s. Vertically it starts from rest, so it drops \( \tfrac{1}{2}(9.81)(0.167)^{2} = 0.136 \) m — about 14 cm below the centre.
(b) \(1.50 = \tfrac{1}{2}(9.81)t^{2}\), so \(t = 0.553\) s.
(c) Neither — they land together. Both begin with zero vertical velocity and both fall 1.50 m with the same vertical acceleration; the horizontal motion of the fired bullet has no influence at all on how long it takes to fall.
7. An object is thrown from the top of a 12.0 m cliff at 15 m s\(^{-1}\), directed at 40° below the horizontal. Find (a) the time before it hits the ground and (b) how far from the base of the cliff it lands.
Resolve, taking downwards as positive: \(u_x = 15\cos 40^\circ = 11.5\) m s\(^{-1}\) and \(u_y = 15\sin 40^\circ = 9.64\) m s\(^{-1}\) downwards.
(a) Vertically, \(12.0 = 9.64t + \tfrac{1}{2}(9.81)t^{2}\), i.e. \(4.905t^{2} + 9.64t - 12.0 = 0\), whose positive root is \(t = 0.86\) s.
(b) Horizontally, \(x = 11.5 \times 0.86 = 9.9\) m. The vertical component is not zero here, which is exactly what makes this harder than the bullet in question 6 — there is no way round the quadratic.
8. Decide whether each of these is physically possible. If it is, give an example; if not, explain why not. (a) Varying velocity with constant speed. (b) Varying speed with constant velocity. (c) Zero velocity with non-zero acceleration. (d) Constant acceleration with constant speed.
(a) Possible. Circular motion at a steady rate: the direction of the velocity changes continuously while its magnitude does not.
(b) Impossible. Speed is the magnitude of velocity, so if the velocity is constant its magnitude cannot be changing.
(c) Possible. A ball at the highest point of a vertical throw: for that instant \(v = 0\), while \(a = g\) downwards throughout.
(d) Only if the acceleration is zero. Keeping the speed constant would need the acceleration to stay perpendicular to the velocity, but the velocity keeps turning while a constant acceleration points one fixed way. The only case that survives is \(a = 0\) — motion at constant velocity in a straight line.
9. Explain, in terms of forces, why the velocity–time graph of a falling object with significant air resistance flattens towards a horizontal asymptote.
🔗Go deeper — other people’s work
These are external resources, not mine. If one stops working, tell me and everything above it on this page still stands.
- The Physics Classroom — 1D Kinematics tutorial
- The Physics Classroom — Vectors and Projectiles
- The Physics Hypertextbook — kinematics
- PhET — Projectile Motion simulation