Theme E · Nuclear and quantum physics · SL and HL, with additional HL material marked
This topic starts with the most famous experiment in physics and ends with the model that replaced
the one it established. The through-line is evidence: every claim here was forced on
physicists by something they measured.
🎯What you need to be able to do
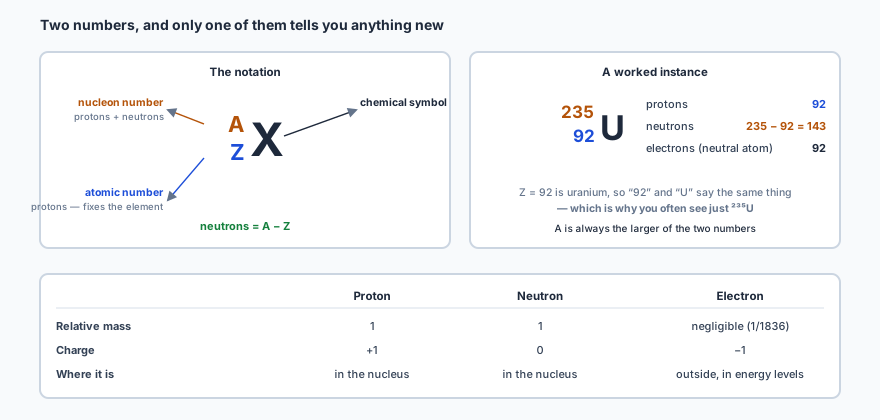
Use nuclear notation \( ^{A}_{Z}\text{X} \), and state what protons, neutrons and electrons contribute in mass and charge.
Describe the nuclear model of the atom, including its scale — and state the limitation that eventually broke it.
Describe the Rutherford–Geiger–Marsden experiment and explain what each observation shows.
Distinguish emission from absorption spectra, and explain both in terms of quantized energy levels.
Use \( E = hf \) to relate a photon’s energy to the gap between two levels.
HLUse \( R = R_0A^{1/3} \), and show that nuclear density is the same for every nucleus.
HLFind the distance of closest approach of an alpha particle from energy conservation.
HLUse the Rydberg formula, and describe the Bohr model with its successes and its limitations.
🧩What everything is made of
All matter, living or otherwise, is built from about a hundred different kinds of atom. Atoms of a
single kind form an element, each with a name and a chemical symbol — H for
hydrogen, O for oxygen — and the full list is the periodic table. Every atom is made of just
three things: protons, neutrons and electrons.
\[ ^{A}_{Z}\text{X} \]
\(Z\) is the atomic number, the number of protons, and it is what decides which
element you have. \(A\) is the nucleon number (or mass number), the number of protons
plus neutrons. So the neutron count is \( A - Z \), which is worth writing down as a formula
because it is asked for constantly.
Because \(Z\) alone fixes the element, the symbol and \(Z\) carry the same information — which is why \(Z\) is often left off entirely, and why an exam question can ask you to justify writing either one.
✏️Worked example 1 — reading and writing the notation
A nucleus of one form of uranium contains 92 protons and 143 neutrons. Write it in nuclear
notation, and state how many electrons the neutral atom has.
Atomic number. \( Z = 92 \), the proton count — and 92 is uranium, so the
symbol is U.
Nucleon number. \( A = 92 + 143 = 235 \).
\[ ^{235}_{\ 92}\text{U} \]
A neutral atom has as many electrons as protons, so 92 electrons.
\(A\) is always the bigger number, because it counts the protons and the
neutrons. If you have written the smaller one on top, you have them the wrong way round. The only
nucleus for which they are equal is ordinary hydrogen, \( ^{1}_{1}\text{H} \), which has no
neutron at all.
⚛️The nuclear model, and how empty it is
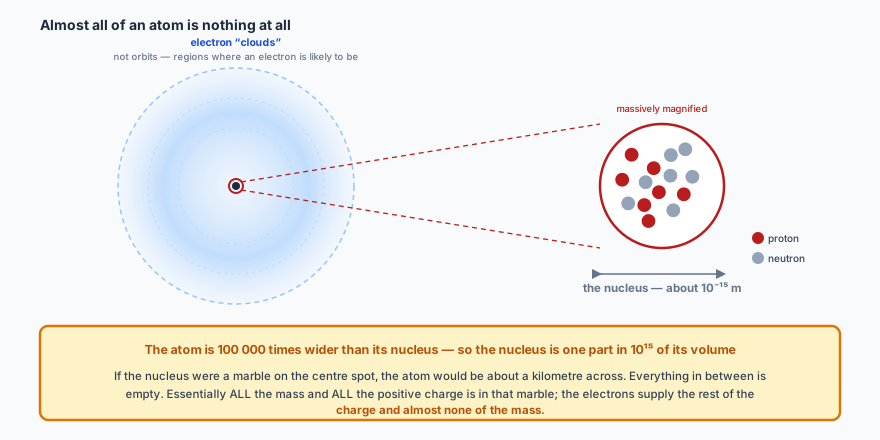
In the nuclear model, a very small central nucleus containing the protons and
neutrons — collectively the nucleons — is surrounded by electrons
arranged in different energy levels. Essentially all the mass and all the positive charge is in the
nucleus; the electrons supply all the negative charge and almost none of the mass.
The numbers are what make this strange. An atom is about \( 10^{-10} \) m across and its nucleus
about \( 10^{-15} \) m — a factor of 100 000. Cube that and the nucleus occupies
roughly one part in \( 10^{15} \) of the atom’s volume. The vast majority of an atom is
nothing at all.
Electrons are drawn as clouds, not dots, because their exact positions are not known — only the regions where they are likely to be found. Those regions are the energy levels that the rest of this page is about.This model contains the seed of its own destruction, and that is the point. An
electron going round a nucleus is continually changing direction, so it is accelerating —
and accelerating charges are known to radiate energy. An orbiting electron should therefore lose
energy continuously and spiral into the nucleus in a fraction of a second. Atoms plainly do not do
this. The nuclear model is right about where the mass and charge are and wrong about what the
electrons are doing, and resolving that is what quantum theory was built to do.
🔬The evidence: Rutherford, Geiger and Marsden
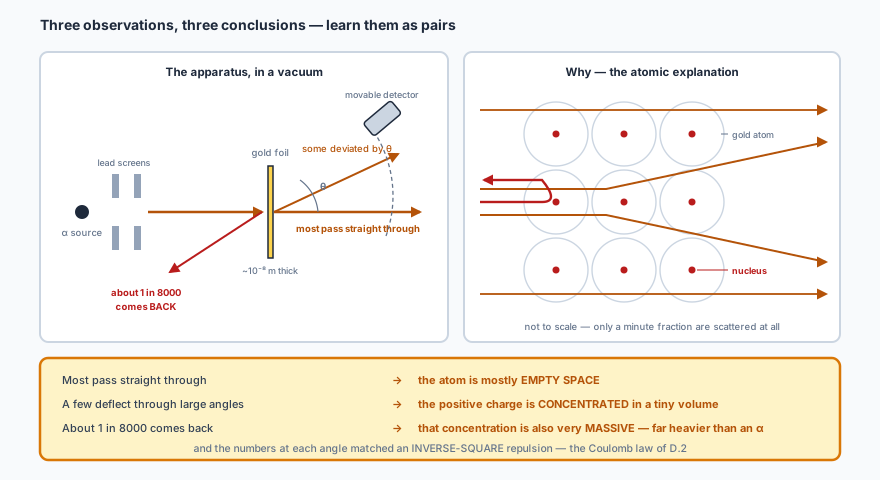
The nuclear model is strange enough that it needs good evidence, and the best of it comes from one
experiment. Positive alpha particles were fired at a very thin gold foil, about \( 10^{-8} \) m
thick, in a vacuum, and a movable detector counted how many arrived at each angle.
The expectation, on the then-current model of the atom as a diffuse blob of positive charge, was
that almost everything would pass more or less straight through. What they found was:
Most alpha particlespassed straight through, barely deviated
Somewere deflected through large angles
About 1 in 8000came back — deflected through more than 90°
Each observation forces a separate conclusion, and exam questions ask for them as a matched pair — so learn them as pairs, not as a list.
Most pass straight throughthe atom is mostly empty space
A few deflect a lotthe positive charge is concentrated in a tiny volume
Some come backthat concentration is also very massive — far heavier than an alpha particle
The mathematics went further than the qualitative picture. The number of particles deflected
through any given angle matched the prediction of an inverse-square law of repulsion
from a point-like nucleus — which is Coulomb’s law from D.2, turning up as the explanation
for a scattering pattern.
🌈Emission and absorption spectra
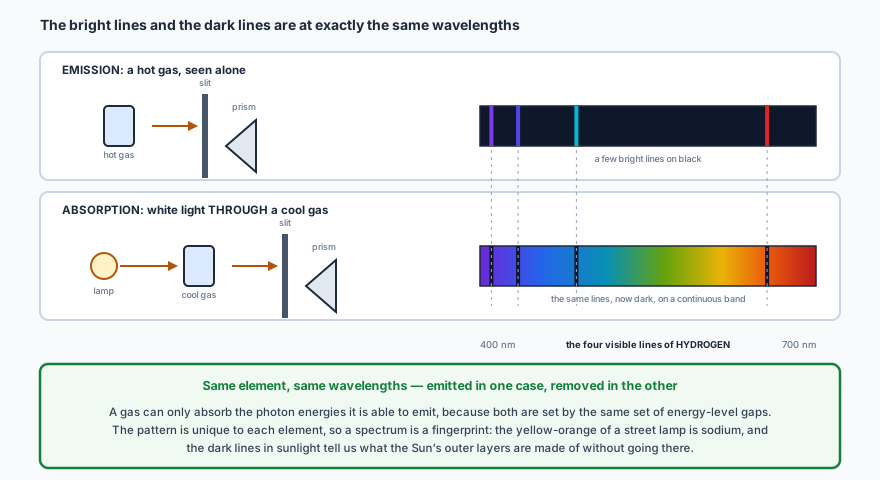
Give an element enough energy and it emits light. Split that light with a prism or a diffraction
grating and you do not get a continuous band of colour. You get a handful of sharp lines at
particular wavelengths — an emission spectrum — and which lines you get
depends on the element.
Now do the reverse. Shine light containing all frequencies through the same element as a
cool gas, and exactly those same wavelengths are missing from what comes out, leaving dark lines on a
continuous background. That is an absorption spectrum.
The bright lines and the dark lines are at exactly the same wavelengths. That is the single most important fact about these two spectra, and it is what tells you they have a common cause.
Because the pattern is unique to each element, a spectrum is a fingerprint. The yellow-orange glow
of a street lamp is sodium announcing itself; the dark lines in sunlight tell you which elements are
in the Sun’s outer layers, without going there.
💡Why they are lines: the energy levels are quantized
Electrons in an atom are bound to the nucleus — they cannot escape without
being given energy, and if one is given enough to leave, the atom is left positive and is said to be
ionized. The crucial discovery is that a bound electron cannot have just any energy.
It may occupy only certain particular energies: they are quantized.
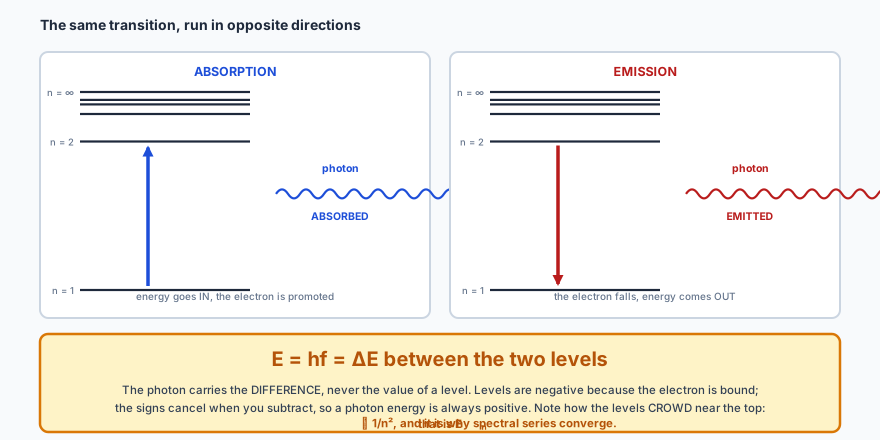
When an electron moves between two levels it must absorb or emit exactly the difference, and it
does so as a single packet of light called a photon:
\[ E = hf \qquad h = 6.63 \times 10^{-34}\ \text{J s} \]
and since \( c = f\lambda \), the same relation can be written \( E = hc/\lambda \).
Absorption and emission are the same transition run in opposite directions, which is exactly why the two spectra have lines at the same wavelengths.A photon’s energy is a DIFFERENCE, never a level. If the levels are at
−3.4 eV and −1.5 eV, the photon carries 1.9 eV — not 3.4, not 1.5, and certainly
not −1.9. Take the magnitude of the gap. The negative signs belong to the levels (an electron
is bound, so its energy is below the zero at infinity, exactly as in D.1) and they cancel when you
subtract.
✏️Worked example 2 — from a transition to a colour
In hydrogen the \( n = 4 \) level lies at −0.85 eV and the \( n = 2 \) level at
−3.40 eV. Find the wavelength of the photon emitted when an electron falls from \(n = 4\) to
\(n = 2\), and say what colour it is.
The gap. \( \Delta E = 3.40 - 0.85 = 2.55 \) eV. Convert to joules:
\( 2.55 \times 1.60\times10^{-19} = 4.08\times10^{-19} \) J.
\[ f = \frac{E}{h} = \frac{4.08\times10^{-19}}{6.63\times10^{-34}} = 6.15\times10^{14}\ \text{Hz} \]
That is in the blue-green part of the visible spectrum.
The accepted value is 486.1 nm, and the 1 nm difference is instructive. It is not
an error in the method — it comes from the rounding in “−0.85” and
“13.6”, which are themselves rounded versions of more precise numbers. Spectroscopy is
one of the most precise measurements in all of physics, so a model that got only three significant
figures right would not have convinced anyone. Keep more digits when a question is about agreement
with experiment rather than about the method.
HLHow big is a nucleus, and how dense?
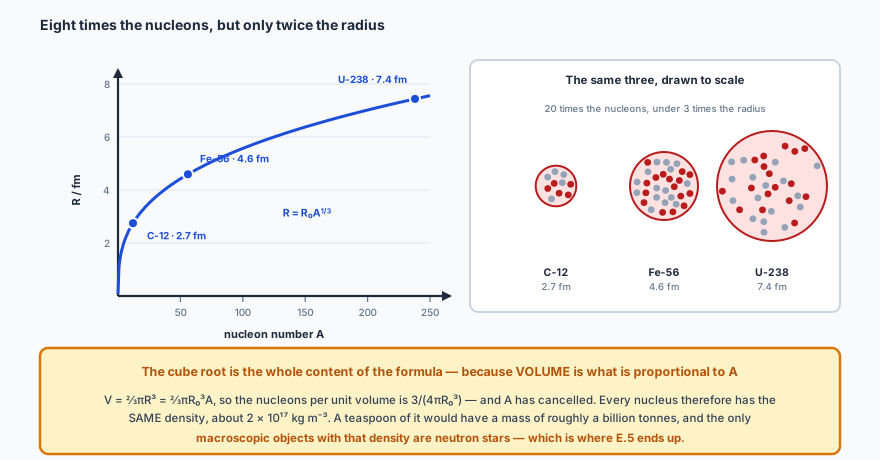
More massive nuclei are larger, and detailed analysis of scattering data shows they behave like
hard spheres packed at an essentially constant density. That single fact fixes how
the radius grows with the nucleon number:
The cube root is the whole content of the formula: a nucleus with eight times the nucleons has only twice the radius. Volume goes as \(R^{3}\), and volume is what is proportional to \(A\).
Because the volume is \( V = \tfrac{4}{3}\pi R^{3} = \tfrac{4}{3}\pi R_0^{3}A \), the nucleons per
unit volume is \( A/V = 3/(4\pi R_0^{3}) \) — and \(A\) has cancelled. Multiply by the mass of a
nucleon (\( \approx 1.7\times10^{-27} \) kg) and you get the density of every nucleus:
That is a genuinely absurd number. A teaspoon of it would have a mass of around a billion tonnes.
The only macroscopic objects in the universe with this density are neutron stars,
which is where E.5 ends up.
✏️HLWorked example 3 — two nuclei, one density
Find the radius of an iron-56 nucleus and of a uranium-238 nucleus, and show that their densities
are the same. Take \( R_0 = 1.2 \) fm and the mass of a nucleon as \( 1.66\times10^{-27} \) kg.
Iron. \( V = \tfrac{4}{3}\pi(4.59\times10^{-15})^{3} = 4.05\times10^{-43} \)
m\(^{3}\); mass \( = 56 \times 1.66\times10^{-27} = 9.30\times10^{-26} \) kg; so
\( \rho = 2.3\times10^{17} \) kg m\(^{-3}\).
Uranium. \( V = 1.72\times10^{-42} \) m\(^{3}\); mass
\( = 3.95\times10^{-25} \) kg; so \( \rho = 2.3\times10^{17} \) kg m\(^{-3}\).
Identical, to every figure carried. That is not a coincidence to be remarked on
— it is built into \( R = R_0A^{1/3} \), which was written down because the density
is constant. Uranium has 4.25 times the nucleons of iron and 4.25 times the volume, so the ratio
is unchanged. If your two answers differ, you have made an arithmetic slip, not a discovery.
HLHow close can an alpha particle get?
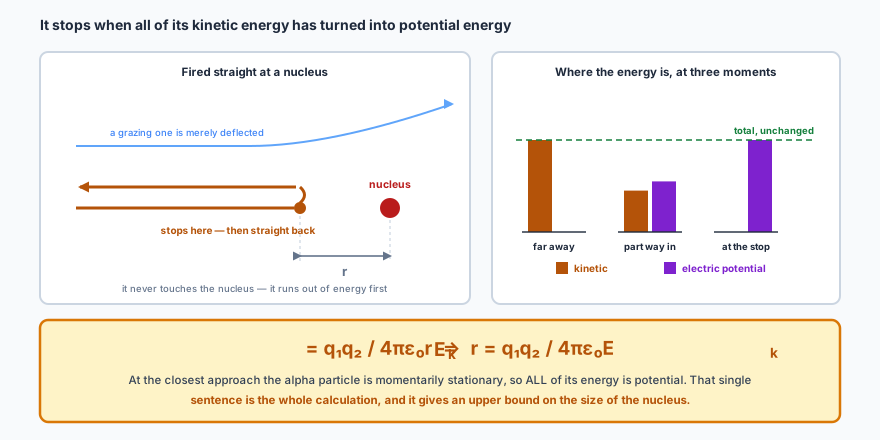
An alpha particle fired at a nucleus is repelled, slows down, stops, and comes back. At the moment
it is stationary all of its kinetic energy has become electric potential energy, and
that is the whole calculation:
The alpha particle never reaches the nucleus — it runs out of energy first. The distance at which that happens is an upper bound on the nuclear radius, which is how the size of a nucleus was first estimated.
✏️HLWorked example 4 — closest approach to a gold nucleus
An alpha particle (\( Z = 2 \)) with 4.2 MeV of kinetic energy is fired directly at a gold nucleus
(\( Z = 79 \)). Find its distance of closest approach.
(\( \varepsilon_0 = 8.85\times10^{-12} \), \( e = 1.6\times10^{-19} \) C.)
Convert the energy.
\( E_k = 4.2\times10^{6} \times 1.6\times10^{-19} = 6.72\times10^{-13} \) J.
The two charges. \( q_1 = 2e \) and \( q_2 = 79e \).
Compare that with the nucleus itself. A gold nucleus has
\( R = 1.2 \times 197^{1/3} = 7.0 \) fm \( = 7.0\times10^{-15} \) m, so the alpha particle stops
nearly eight times further out than the nuclear surface. It never gets near enough to
touch, which is exactly why ordinary Rutherford scattering sees only the Coulomb repulsion and
never the strong nuclear force. Push the energy high enough and that stops being true — see
below.
HLWhere Rutherford scattering breaks down
Rutherford’s analysis models the scattering as pure Coulomb repulsion between the alpha
particle and the nucleus, and at moderate energies it predicts the measured intensities at each angle
very accurately. At high energies it stops working.
Fix the detector at one angle and increase the alpha energy, and the measured intensity follows the
Rutherford prediction until, at around 27.5 MeV, it departs from it. The reason is
the previous section in reverse: more energy means a closer approach, and eventually the alpha
particle gets close enough for the strong nuclear force (E.3) to start acting. Once a
second force is involved, a model built on only one of them must fail.
This is a nice piece of scientific reasoning to be able to reproduce: the point at which a
model breaks tells you something real. Here the breakdown energy is a measure of how close you
have to get before the strong force appears, and therefore of the size of the nucleus. Probing finer
detail needs a different tool again — high-energy electrons, which do not feel the strong force
at all.
HLThe hydrogen spectrum and the Rydberg formula
Hydrogen’s emission spectrum was measured long before anyone could explain it. In 1885 a
Swiss schoolteacher, Johann Balmer, noticed that the visible wavelengths fitted a formula. Those lines
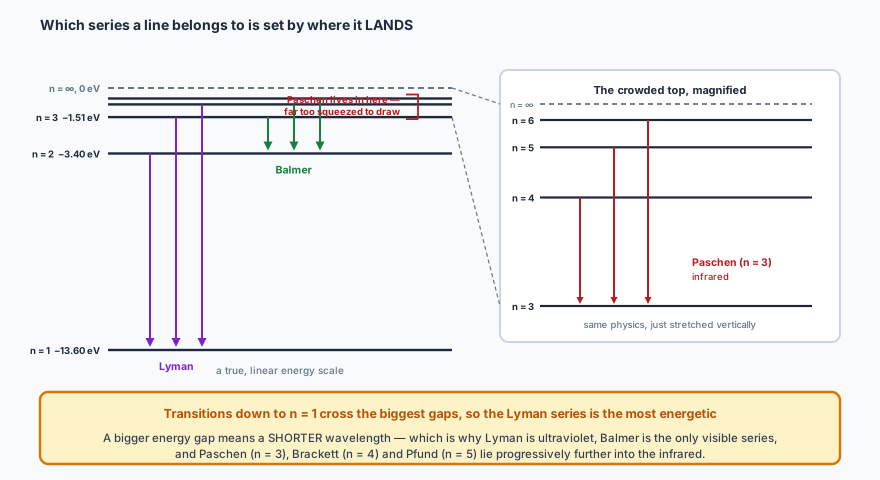
are the Balmer series, and they turned out to be one of several such families, all
described by a single expression — the Rydberg formula:
with \(m\) any whole number larger than \(n\). Each value of \(n\) gives a whole series, named after
whoever found it:
Lyman, \( n = 1 \)ultraviolet
Balmer, \( n = 2 \)visible
Paschen, \( n = 3 \)infrared
Brackett, \( n = 4 \) · Pfund, \( n = 5 \)further into the infrared
Which series a line belongs to is set by where it lands, not where it starts. Transitions down to \(n=1\) cross the biggest gaps, so the Lyman series is the most energetic and lies in the ultraviolet.
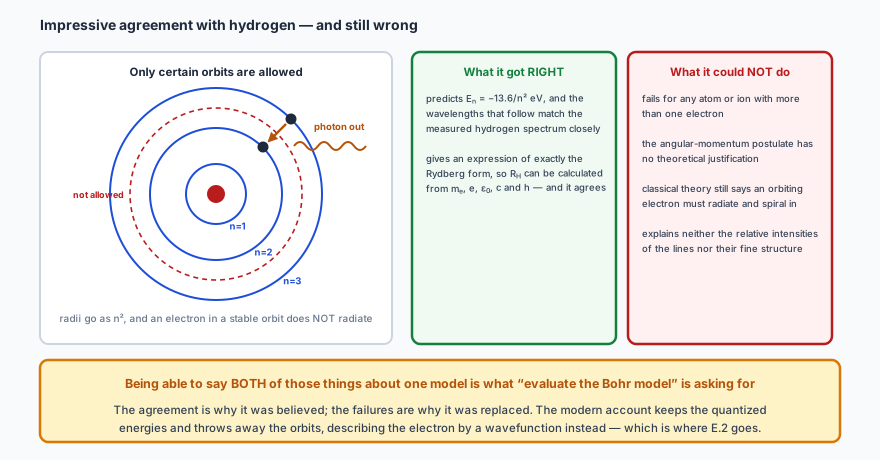
HLThe Bohr model
Niels Bohr took the planetary picture of hydrogen and added a restriction that had no
justification at the time but produced the right answer. He postulated:
First postulatean electron in a stable orbit does not radiate, and only orbits whose angular momentum is a whole multiple of \( h/2\pi \) are allowed: \( m_evr = nh/2\pi \)
Second postulatean electron moving between allowed orbits emits or absorbs the energy difference as a photon
Setting the electrostatic attraction equal to the centripetal force and substituting the quantized
angular momentum gives the allowed radii, and hence the allowed energies:
\[ E_n = -\frac{13.6}{n^{2}}\ \text{eV} \]
The agreement with hydrogen is genuinely impressive — and the model is still wrong. Being able to say both of those things about the same model is what the question “evaluate the Bohr model” is asking for.
Two things follow immediately from that expression, and both are worth stating in an answer. The
energy is negative, which means the electron is bound — trapped by the proton.
And it goes as \( 1/n^{2} \), so the levels crowd together as \(n\) rises and converge on zero, which
is the ionisation limit: 13.6 eV supplied to a ground-state electron frees it
completely.
Bohr’s expression for \( 1/\lambda \) has exactly the form of the Rydberg formula, and the
Rydberg constant can be calculated from \(m_e\), \(e\), \(\varepsilon_0\), \(c\) and \(h\) —
constants measured in completely unrelated experiments. That agreement is why the model was taken
seriously. But it fails for every atom with more than one electron, its central postulate has no
justification, and it still cannot explain why the orbiting electron does not radiate. The modern
account replaces orbits with wavefunctions, which is where E.2 goes.
🔭See it happen
PhET, Rutherford Scattering lets you fire alpha particles at a nucleus and vary
their energy and the target’s atomic number — watch the closest approach shrink as you
wind the energy up. Then PhET, Models of the Hydrogen Atom puts the competing models
side by side and shows you the spectrum each one predicts, with the real spectrum alongside for
comparison. It is the fastest way to see why Bohr’s model was believed and why it was not
enough.
📝Practise
Work through these, then reveal the answer. Each question targets a different objective from the list above.
1. A nucleus contains 26 protons and 30 neutrons. Write it in nuclear notation, and state which of the three symbols \(A\), \(Z\) and X carry the same information.
\( Z = 26 \), which is iron, so the symbol is Fe. \( A = 26 + 30 = 56 \), giving \( ^{56}_{26}\text{Fe} \).
\(Z\) and X carry the same information: the atomic number fixes the element and the element fixes the atomic number, so writing both is strictly redundant — which is why you often see just \( ^{56}\text{Fe} \). \(A\) is the one that adds something, because it tells you the neutron count, \( A - Z \).
2. Explain the significance of the negative values of atomic energy levels.
The zero of energy is taken to be a free electron at rest, infinitely far from the nucleus. A bound electron has less energy than that, so its energy is negative. The magnitude of a level is therefore the energy that must be supplied to remove that electron from the atom entirely. The more negative the level, the more tightly bound the electron — exactly the same convention, and the same reasoning, as gravitational potential in D.1.
3. Four levels of an atom lie at −0.85, −1.51, −3.40 and −13.6 eV. Find the longest and the shortest wavelength that transitions between them can produce.
The longest wavelength comes from the smallest energy gap, which is between the top two levels: \( \Delta E = 1.51 - 0.85 = 0.66 \) eV \( = 1.06\times10^{-19} \) J, giving \( \lambda = hc/E = 1.9\times10^{-6} \) m — about 1900 nm, in the infrared.
The shortest comes from the largest gap, from the top level down to the bottom: \( \Delta E = 13.6 - 0.85 = 12.75 \) eV \( = 2.04\times10^{-18} \) J, giving \( \lambda = 9.7\times10^{-8} \) m — about 97 nm, in the ultraviolet. Note that the biggest gap gives the shortest wavelength; getting that inversion the wrong way round is the usual error.
4. Determine how many different spectral lines transitions between those four levels can produce.
Six. Every distinct pair of levels gives one line, and the number of pairs from four levels is \( \binom{4}{2} = (4 \times 3)/2 = 6 \). Listing them: 4→3, 4→2, 4→1, 3→2, 3→1, 2→1. It does not matter that a cascade like 4→3→1 involves two steps — each step is one of the six.
5. Explain how an absorption spectrum arises in the light from a star, and outline what can be deduced from it.
The star’s hot, dense interior emits a continuous spectrum. On the way out, that light passes through the cooler, less dense gas of the star’s outer atmosphere. Electrons in those atoms absorb photons whose energies exactly match gaps between their energy levels, removing those particular wavelengths from the beam and leaving dark lines.
What can be deduced: the wavelengths of the missing lines identify which elements are present, because the level pattern is unique to each element; the relative darkness of the lines indicates how much of each element there is; and any overall shift of the whole pattern gives the star’s speed towards or away from us by the Doppler effect (C.5).
6. State the three main observations of the Rutherford–Geiger–Marsden experiment and the conclusion each one supports.
Most alpha particles passed straight through, barely deviated → the atom is mostly empty space. A small number were deflected through large angles → there is a concentration of positive charge in a very small volume, repelling them. About 1 in 8000 was turned back through more than 90° → that concentration must also be very massive compared with an alpha particle, or it would simply have been knocked aside instead.
A fourth point earns credit if asked for the mathematics: the number scattered at each angle matched an inverse-square law of repulsion, confirming a point-like Coulomb source.
7. HLEstimate the radius of a lead-208 nucleus, and state how it compares with carbon-12.
\( R = R_0A^{1/3} = 1.2\times10^{-15} \times 208^{1/3} = 1.2\times10^{-15} \times 5.93 = 7.1\times10^{-15} \) m, or 7.1 fm.
For carbon-12, \( R = 1.2 \times 12^{1/3} = 2.7 \) fm. So lead has 17 times the nucleons of carbon but only 2.6 times the radius — because \( R \propto A^{1/3} \), and \( 17^{1/3} = 2.6 \).
8. HLShow that every nucleus has approximately the same density, and comment on its size.
Volume \( V = \tfrac{4}{3}\pi R^{3} = \tfrac{4}{3}\pi R_0^{3}A \), so \( V \propto A \). The mass is also proportional to \(A\), since it is \(A\) nucleons each of mass \( \approx 1.7\times10^{-27} \) kg. Density is mass over volume, so \(A\) cancels and the density is the same for every nuclide:
\[ \rho = \frac{3m}{4\pi R_0^{3}} = \frac{3 \times 1.7\times10^{-27}}{4\pi(1.2\times10^{-15})^{3}} \approx 2\times10^{17}\ \text{kg m}^{-3} \]
This is around \( 10^{14} \) times the density of water. Nothing on Earth comes close; the only objects with it are neutron stars, which are essentially nuclear matter on an astronomical scale.
9. HLAlpha particles of mass \( 6.7\times10^{-27} \) kg travelling at \( 2.0\times10^{6} \) m s\(^{-1}\) are fired at gold nuclei (\( Z = 79 \)). Calculate how close they get.
First the kinetic energy: \( E_k = \tfrac{1}{2}mv^{2} = \tfrac{1}{2} \times 6.7\times10^{-27} \times (2.0\times10^{6})^{2} = 1.34\times10^{-14} \) J.
At the closest approach all of it has become electric potential energy:
\[ r = \frac{q_1q_2}{4\pi\varepsilon_0E_k} = \frac{(2 \times 1.6\times10^{-19})(79 \times 1.6\times10^{-19})}{4\pi \times 8.85\times10^{-12} \times 1.34\times10^{-14}} = 2.7\times10^{-12}\ \text{m} \]
Note how far out that is — about 400 times the radius of the gold nucleus — because these alphas are slow. Compare the 4.2 MeV alphas of Worked example 4, which reach \( 5.4\times10^{-14} \) m.
10. HLOutline two successes and two limitations of the Bohr model.
Successes: it predicts the energy levels of hydrogen as \( E_n = -13.6/n^{2} \) eV, and the wavelengths that follow agree with the measured hydrogen spectrum to high precision; and it yields an expression of exactly the Rydberg form, allowing \(R_H\) to be calculated from \(m_e\), \(e\), \(\varepsilon_0\), \(c\) and \(h\) — constants measured in entirely unrelated experiments — which again matches.
Limitations: it fails to give the correct spectra for any atom or ion with more than one electron; the postulate that angular momentum is quantized in units of \(h/2\pi\) has no theoretical justification within the model; classical theory still predicts that an orbiting (accelerating) electron must radiate and spiral inwards, which the model simply asserts does not happen; and it accounts for neither the relative intensities of the spectral lines nor their fine structure.
🔗Go deeper — other people’s work
These are external resources, not mine. If one stops working, tell me and
everything above it on this page still stands.
HyperPhysics — the Rutherford experiment, hydrogen spectrum and nuclear size
The Physics Hypertextbook — atomic structure and spectra