Analytical techniques
🎯What you need to be able to do
- Analyse the infrared spectrum of a simple molecule to identify its functional groups, using the table in the data section.
- Analyse mass spectra in terms of m/e values and isotopic abundances (how the instrument works is not required).
- Calculate a relative atomic mass from isotopic abundances or from a mass spectrum.
- Deduce the Mr of an organic molecule from its molecular ion peak, and suggest the identity of fragments.
- Use the [M+1]+ peak to find the number of carbon atoms, and the [M+2]+ peak to detect chlorine and bromine.
📚The chemistry
22.1 Infrared spectroscopy
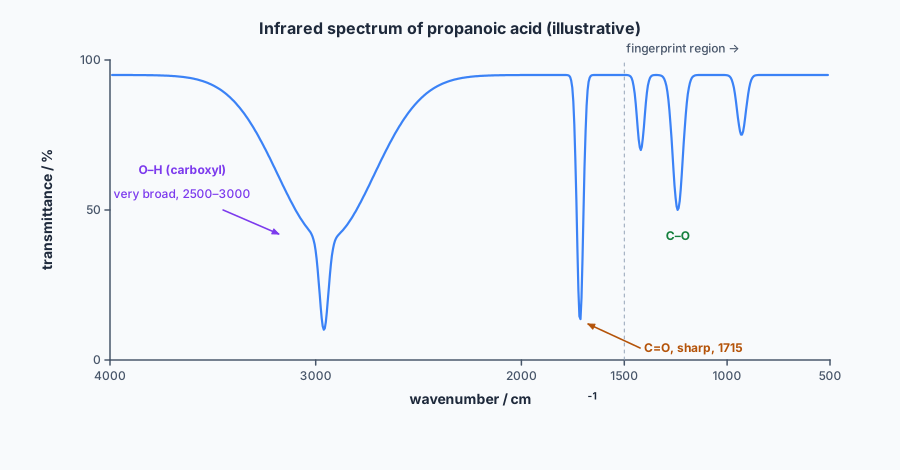
Covalent bonds vibrate — they stretch and bend — at particular frequencies, and a bond absorbs infrared radiation of the same frequency. An infrared spectrum plots transmittance (%) against wavenumber (cm−1), so absorptions appear as dips pointing downwards. Each type of bond absorbs in a characteristic range, so the dips reveal which bonds — and therefore which functional groups — the molecule contains.
The ranges you use are printed in the data section:
How to read a spectrum:
- Start above 1500 cm−1. Below that is the fingerprint region, full of overlapping absorptions that are hard to assign individually (apart from C–O at 1040–1300).
- Almost every organic molecule has C–H absorptions near 2900. Ignore them unless the question is about them.
- A strong, sharp dip at about 1700 means C=O. Then decide which kind by looking for O–H.
- O–H in an alcohol: a broad dip at 3200–3600, broad because of hydrogen bonding.
- O–H in a carboxylic acid: a very broad dip at 2500–3000, often overlapping the C–H peaks, together with C=O near 1700.
So the three classic cases are: O–H (3200–3600) only → alcohol; C=O only → aldehyde, ketone or ester; very broad O–H (2500–3000) and C=O → carboxylic acid.
22.2 Mass spectrometry
In a mass spectrometer, molecules are ionised to positive ions, which are separated by their mass-to-charge ratio, m/e. Almost all ions have a 1+ charge, so m/e is simply the mass of the ion. The spectrum plots relative abundance against m/e. You do not need to know how the instrument works.
Isotopes and relative atomic mass
The mass spectrum of an element shows one peak per isotope, with heights proportional to their abundances. The relative atomic mass is the weighted mean:
Boron has 10B (19.9%) and 11B (80.1%): Ar = (10 × 19.9 + 11 × 80.1)/100 = 10.8. If abundances are given as peak heights rather than percentages, divide by the sum of the heights instead of 100.
The molecular ion
When a molecule loses one electron, it forms the molecular ion, M+:
The molecular ion peak is the peak with the highest m/e (ignoring the small [M+1] and [M+2] peaks beside it). Its m/e is the Mr of the compound.
Fragmentation
The molecular ion often breaks apart. Each break gives a positive ion and a neutral radical; only the ion is detected, so only it gives a peak:
The m/e values of the fragments tell you which groups are present. Common ones:
A difference between the M+ peak and a large fragment peak is just as useful: a loss of 15 means a CH3 group left, a loss of 17 an OH, a loss of 29 an ethyl group or CHO.
The [M+1] peak: counting carbon atoms
About 1.1% of carbon atoms are 13C. A molecule with n carbon atoms therefore has about 1.1n% chance of containing one 13C, which gives a small peak one unit above the molecular ion: the [M+1]+ peak. The more carbons, the bigger it is relative to M+:
The [M+2] peak: chlorine and bromine
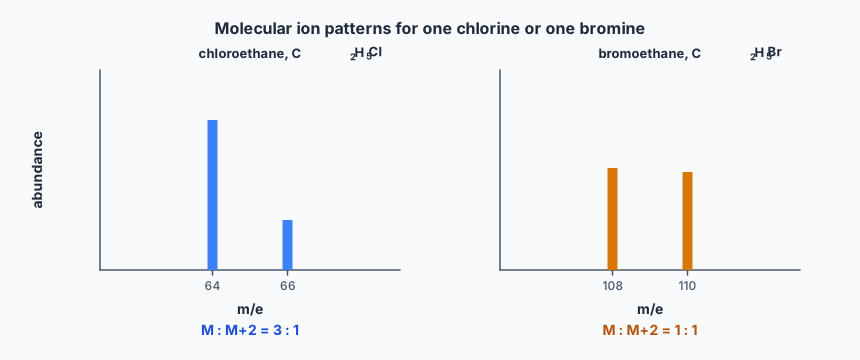
Chlorine and bromine have two common isotopes, each 2 mass units apart, so a molecule containing one of them shows two molecular ion peaks, M and M+2:
- One Cl: 35Cl and 37Cl are roughly 3 : 1, so the M : M+2 peaks are in the ratio 3 : 1.
- One Br: 79Br and 81Br are roughly 1 : 1, so M : M+2 is 1 : 1 — two peaks of almost equal height.
- With two Cl atoms the pattern is M : M+2 : M+4 = 9 : 6 : 1; with two Br, 1 : 2 : 1.
✏️Worked example
• Its infrared spectrum shows a very broad absorption from 2500 to 3000 cm−1 and a strong, sharp absorption at 1715 cm−1.
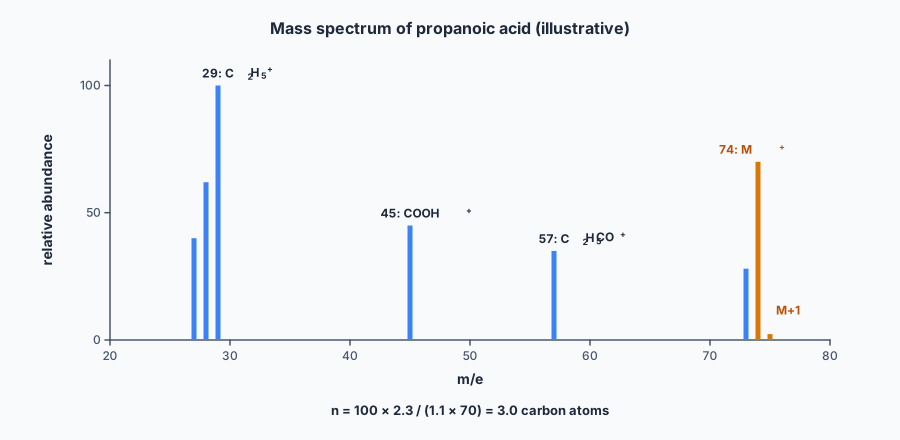
• Its mass spectrum has the molecular ion peak at m/e 74 with relative abundance 20.0, and an [M+1]+ peak with relative abundance 0.66. There are fragment peaks at m/e 29 and 45.
(a) Identify the functional group from the IR spectrum. (b) Calculate the number of carbon atoms. (c) Identify X, and the fragments at 29 and 45. (d) Write an equation for the formation of the fragment at m/e 45.
(a) A very broad O–H absorption at 2500–3000 together with C=O at 1715 is characteristic of a carboxylic acid, –COOH.
(b)
X contains three carbon atoms.
(c) A three-carbon carboxylic acid with Mr 74 is propanoic acid, CH3CH2COOH (3 × 12 + 6 × 1 + 2 × 16 = 74). m/e 29 is C2H5+, and m/e 45 is COOH+ — the two halves of the molecule, from breaking the C–C bond next to the carboxyl group.
(d)
📝Practise
Work through these, then reveal the answer. Each question targets a different objective from the list above.
1. Magnesium consists of 24Mg (79.0%), 25Mg (10.0%) and 26Mg (11.0%). Calculate its relative atomic mass.
2. How would the infrared spectra of propan-1-ol, propanal and propanoic acid differ?
3. The mass spectrum of a compound shows peaks at m/e 108 and 110 of almost equal height, and no peaks at higher m/e. Suggest what this shows and identify the compound if it is a halogenoalkane with two carbons.
4. The M+ peak of a hydrocarbon has abundance 45.0 and the [M+1]+ peak 3.0. The M+ peak is at m/e 86. Find the molecular formula.
5. Butanone, CH3COCH2CH3, has a large peak at m/e 43. Identify the ion and write an equation for its formation.
6. A compound C2H4Cl2 shows molecular ion peaks at m/e 98, 100 and 102. Predict their relative heights and explain.
🔗Go deeper — other people’s work
These are external resources, not mine. If one stops working, tell me and everything above it on this page still stands.
- NIST Chemistry WebBook — real infrared and mass spectra for thousands of compounds, ideal for practising on the molecules in this syllabus
- Chemguide (Jim Clark) — the instrumental analysis section on IR and mass spectra