Advanced Practical Skills
🎯What you need to be able to do
- Set up apparatus and follow instructions; make accurate, consistent measurements and precise observations, including concordant titres.
- Decide how many readings to take, over what range, and when to repeat or confirm.
- Record data in a single, properly headed table, to the correct and consistent precision, and show every step of calculations with appropriate significant figures.
- Plot graphs to the syllabus standard and use them: gradients, intercepts, intersections, extrapolation.
- Interpret data and observations, draw conclusions and explain them with theory.
- Identify sources of error (systematic and random), calculate uncertainty and percentage error, and suggest realistic improvements.
- Carry out titrations, rates, gravimetric, thermometric and gas-volume experiments, and qualitative analysis using the notes provided.
📚How the paper works
Paper 3 has two or three questions, 40 marks, in 2 hours:
- one or two quantitative questions — a titration, or measuring a time, temperature, mass or gas volume — where you draw your own table or graph, process the data and draw conclusions;
- one qualitative (observational) question, investigating unknown substances by specified tests and recording what you see. The qualitative analysis notes (reactions of cations and anions, tests for gases and elements) are printed in the paper.
The marks follow the syllabus skills grid:
The questions may involve chemistry outside the syllabus content; any extra information you need is given. You are marked on practical skill, not on recall.
🔬Measuring and observing
Precision you must record to
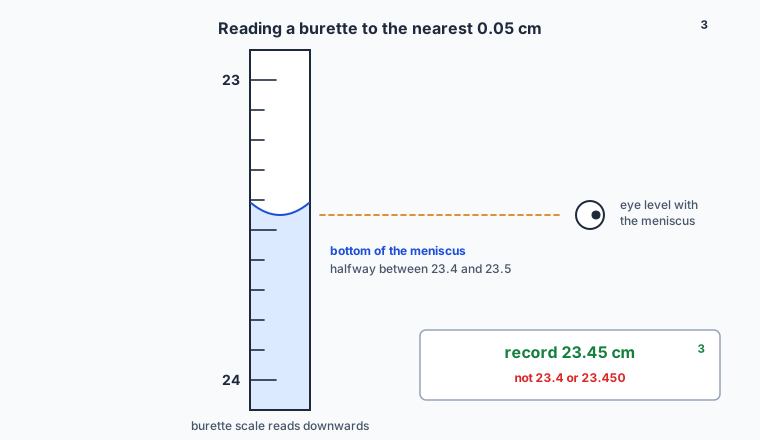
- Burette readings to the nearest 0.05 cm3: 23.45, not 23.4 or 23.450.
- Thermometer calibrated in 1 °C: read to the nearest 0.5 °C: 21.5 °C.
- Measuring cylinder calibrated in 1.0 cm3: to the nearest 0.5 cm3.
- Balance: to the precision it displays, and every mass in a set to the same number of decimal places.
Titrations
- Rinse the burette with the solution it will contain, fill with a funnel and then remove the funnel, and run a little out so the tip is full and bubble-free.
- Do a rough titration first to find the approximate end-point, then accurate ones, adding dropwise near the end-point and swirling, over a white tile.
- Continue until you have concordant titres: two within 0.10 cm3 of each other. Use only concordant titres in the mean; do not include the rough titre.
- Titrations you should have done: acid–alkali with indicators; potassium manganate(VII) with hydrogen peroxide, iron(II) or ethanedioate (self-indicating: the first permanent pale pink); sodium thiosulfate with iodine (starch added near the end-point, blue-black → colourless).
The other quantitative experiments
- Rates: mix reagents and time an event, such as the print under a flask being obscured by the sulfur precipitate from thiosulfate and acid. Rate ∝ 1/time (AS 8).
- Gravimetric: heat a solid in a crucible on a pipeclay triangle and record the mass change — e.g. water of crystallisation. Heat to constant mass (reheat until two weighings agree) to show the reaction is complete (AS 2).
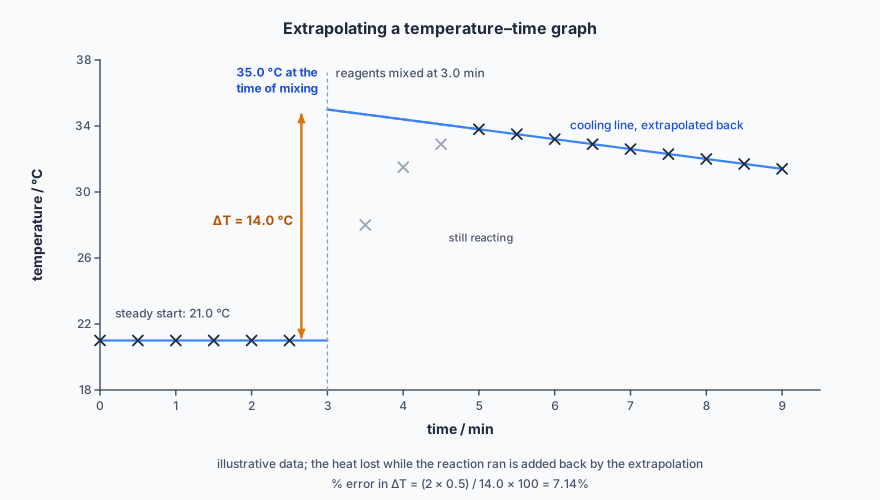
- Thermometric: record temperature changes in a polystyrene cup, calculate enthalpy changes, and use Hess’s law to combine them (AS 5). Stir, and read the maximum or minimum temperature; for slow reactions, extrapolate a temperature–time graph back to the time of mixing.
- Gas volume: collect gas over water in an inverted measuring cylinder or burette, e.g. CO2 from a carbonate and acid, to find the composition of a solid.
Qualitative analysis
- Use small amounts, add only what the instructions say, and heat solids in a hard-glass tube held in a holder.
- Record every observation, including “no change” or “remains a colourless solution”. An empty box scores nothing.
- When a precipitate forms with NaOH(aq) or NH3(aq), add excess to see whether it dissolves — that is what distinguishes Al3+ from Mg2+, or Zn2+ from Ca2+.
- If there is effervescence, identify the gas with the right test (limewater, lighted splint, glowing splint, damp red litmus).
- Describe colours precisely: “pale blue precipitate”, “dark blue solution”, “green precipitate turning brown on contact with air”. Use the same words the notes use.
- Know the organic tests too: an orange-red precipitate with Fehling’s or a silver mirror with Tollens’ (aldehyde); a yellow precipitate with alkaline aqueous iodine (CH3CO– or CH3CH(OH)–); acidified KMnO4 purple → colourless (something oxidisable).
If the unknown contains an ion not in the notes, you are not expected to identify it — record your observations and draw a general conclusion.
📊Presenting the results
Tables
- One table for all the data, drawn before you start, so you record straight into it and never copy results.
- Column headings with quantity and unit separated by a solidus or brackets: volume / cm3, time (s), T / °C. No units in the body of the table.
- Raw readings to the same precision throughout a column: if one mass is 0.06 g, all masses are to 0.01 g.
- For titrations, record initial and final burette readings and the titre for every run, and tick the titres used in the mean.
Calculations and significant figures
Show every step, so that method marks can be given even if the answer is wrong. Give calculated values to the same number of significant figures as, or one more than, the least precise data used. A titre of 23.45 cm3 (4 s.f.) with a concentration of 0.100 mol dm−3 (3 s.f.) justifies an answer to 3 or 4 s.f.
Graphs
- Axes labelled like table headings (quantity / unit), independent variable on x.
- Scales of 1, 2 or 5 units per 20 mm square (never 3), with the points covering at least half the grid in both directions. The origin need not be included.
- Points plotted as × or ⊙ with a sharp pencil, to within half a small square.
- A single thin line or smooth curve of best fit with points evenly on both sides along its whole length; identify anomalous points and leave them out of the line.
- For a gradient, use a large triangle: two points on the line more than half the length of the line apart, and show the coordinates you read.
🔎Errors and improvements
- Systematic errors push every reading the same way: a balance with a zero error, a thermometer reading 1 °C high, heat loss in calorimetry. Using the same apparatus for all readings cancels some of them in differences.
- Random errors scatter readings either way: a change in room temperature during a rates experiment, judging the moment a cross disappears. Repeats and means reduce their effect.
- “Human error” is not an acceptable answer. Name the actual source.
- Uncertainty: for this syllabus, the maximum uncertainty in a reading is
half the smallest division. A difference of two readings (a titre, a temperature
change) carries the uncertainty of both:
\[ \%\ \text{error} = \frac{\text{uncertainty}}{\text{measured value}} \times 100 \qquad \text{e.g.}\ \frac{2 \times 0.5}{14.0} \times 100 = 7.14\%\ \text{for}\ \Delta T = 14.0\ ^\circ\mathrm{C} \]
- Identify the largest source of error, and suggest an improvement that deals with that one: a lid and insulation for heat loss; a larger volume or smaller-division instrument for a large percentage error; a light sensor instead of the eye for a disappearing cross; a gas syringe instead of collection over water for a soluble gas.
✏️Worked example
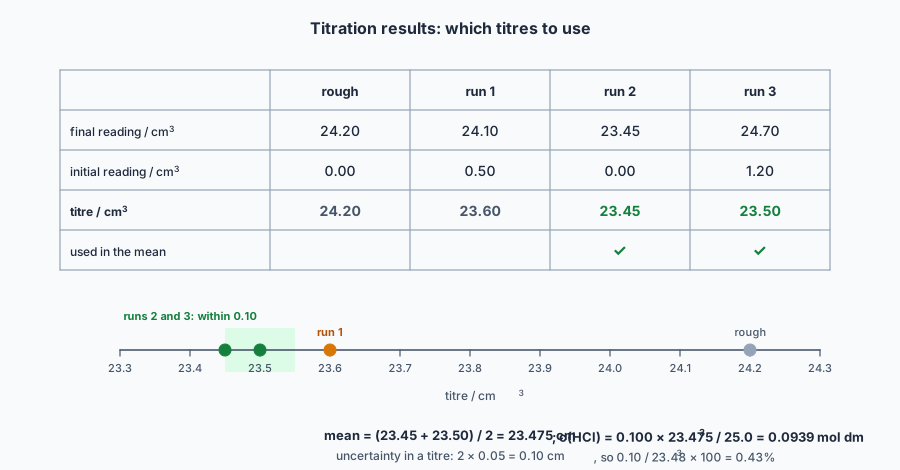
rough: 0.00 → 24.20; run 1: 0.50 → 24.10; run 2: 0.00 → 23.45; run 3: 1.20 → 24.70.
(a) Tabulate the results and identify the titres to use. (b) Calculate the concentration of the acid. (c) Each burette reading has an uncertainty of ±0.05 cm3. Calculate the percentage error in the mean titre.
(a) Titres = final − initial: rough 24.20; run 1 23.60; run 2 23.45; run 3 23.50. A table would have rows for final reading, initial reading and titre (all / cm3, all to 2 decimal places) and a column for each run. Runs 2 and 3 differ by 0.05 cm3, within 0.10, so they are concordant. Run 1 differs from both by more than 0.10 and is not used; nor is the rough titre.
(b) HCl + NaOH → NaCl + H2O, 1 : 1.
The data (0.100 and 25.0) are to 3 s.f., so 3 or 4 s.f. is acceptable: 0.0939 or 0.09390 mol dm−3.
(c) A titre is the difference of two readings, so its uncertainty is 2 × 0.05 = ±0.10 cm3:
📝Practise
Work through these, then reveal the answer. Each question targets a different skill from the list above.
1. A student records masses as 12.3 g, 12.35 g and 12.4 g in one column. What is wrong, and how should they be recorded if the balance reads to 0.01 g?
2. In an experiment the temperature rises from 21.5 °C to 29.0 °C, measured with a thermometer marked in 1 °C. Calculate the percentage error in the temperature change.
3. Name the most significant source of error when finding the enthalpy change of a reaction in a polystyrene cup, and suggest an improvement.
4. Explain the difference between a systematic and a random error, with a chemistry example of each.
5. A white precipitate forms when aqueous NaOH is added to an unknown solution. Describe what to do next, and how the result distinguishes Al3+, Zn2+ and Mg2+.
6. How should a student show that all the water has been removed from a hydrated salt in a crucible?
🔗Go deeper — other people’s work
These are external resources, not mine. If one stops working, tell me and everything above it on this page still stands.
- The 9701 syllabus, section 5 — the full expectations for Paper 3, the apparatus list and the qualitative analysis notes you will be given.
- Cambridge, How to manage your science practical exams — how the exam is organised in your school.
- Royal Society of Chemistry — practical guides for titration, calorimetry and qualitative analysis.