Planning, Analysis and Evaluation
🎯What you need to be able to do
- Define the problem: identify the independent, dependent and controlled variables, express a prediction in words or as a sketch graph, and understand the risks.
- Write a method complete enough to follow: apparatus and its arrangement, quantities, how the independent variable is varied and the dependent variable measured, controls, safety, tables and the graph to be plotted.
- Describe standard quantitative practice: making up standard solutions, weighing by difference, concordant titres, heating to constant mass, extra readings near a key point.
- Deal with data: choose and carry out calculations, plot graphs, find m and c in y = mx + c, calculate percentage errors, use suitable significant figures.
- Draw conclusions supported by the data, with scientific explanation.
- Evaluate: anomalies, replication, range, control of variables, weaknesses of the procedure, and how confident the conclusion can be.
📚How the paper works
Two or more questions, 30 marks, 1 hour 15 minutes. The marks follow the syllabus skills grid:
Planning questions may be open: you write a structured method, with a labelled diagram, flow chart, table or equation where it helps. Analysis questions give you data to process, plot and judge. Some questions are set in chemistry that would be too costly or dangerous to do in school, which is exactly why careful reading of the information given matters.
🔬Planning
Defining the problem
- Independent variable — the one you change (e.g. concentration of thiosulfate).
- Dependent variable — the one you measure (e.g. time for the cross to be obscured), and how it becomes the quantity you want (rate ∝ 1/time).
- Controlled variables — everything else that could affect the result: temperature, other concentrations, total volume, the same cross, the same person observing.
- Prediction — a hypothesis linking the two variables, in words (“the rate is directly proportional to the concentration of thiosulfate”) or as a sketch graph with labelled axes, and explained with theory.
Writing the method
A marker should be able to follow it without asking you anything. Include:
- the apparatus, with sizes and precision (a 50.00 cm3 burette, not “something to measure volume”), and a labelled diagram for any arrangement such as gas collection;
- realistic volumes, masses and concentrations — check that they give a measurable result (a gas volume that fits the syringe, a titre of 20–30 cm3);
- how the independent variable is varied — for concentration, dilute with water keeping the total volume constant — with at least five values over a sensible range;
- how the dependent variable is measured and each control is kept constant (water bath for temperature, same volumes, same apparatus);
- repeats and a control experiment where one is needed to show that it is the independent variable causing the change;
- a results table with headings and units, the graph to be plotted and how it will be used to reach the conclusion.
Standard laboratory practice
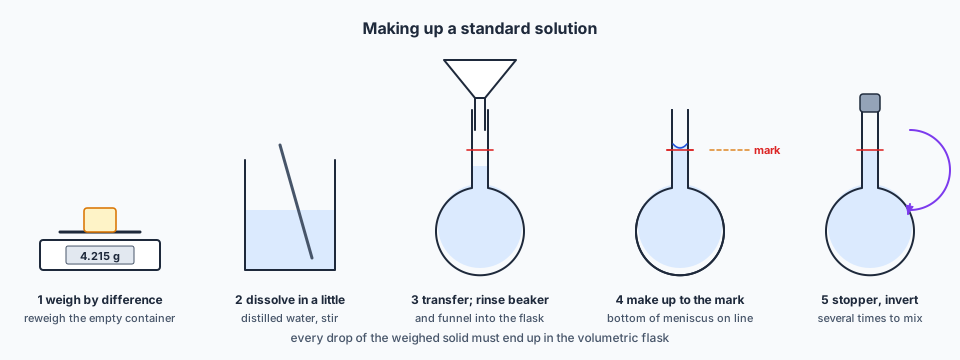
- Making a standard solution: weigh the solid by difference (weigh the container with solid, tip it into a beaker, reweigh the empty container); dissolve in distilled water in a beaker; transfer to a volumetric flask, rinsing the beaker and funnel into it; make up to the mark with the bottom of the meniscus on the line; stopper and invert to mix.
- Titrations: rough then accurate titres until concordant (within 0.10 cm3).
- Heating to constant mass for decompositions and hydrates.
- More readings near an inflexion point, such as the steep part of a pH curve or a turning point in a temperature–volume plot.
Risk
Identify the specific hazard and the specific precaution, not “wear goggles” alone: a fume hood for toxic or irritant gases (SO2, Cl2, NO2); a face mask for hazardous dusts; no naked flames with flammable solvents; chemically resistant gloves for corrosive or irritant liquids.
📊Dealing with data
- Decide what to calculate from the raw data — means, 1/time, moles, percentage change, logarithms — so that the graph will show the relationship clearly.
- Plot to the Paper 3 standard (see that page): labelled axes with units, sensible scales using at least half the grid, precise points, a line of best fit, and anomalies identified.
- For a straight line, find the gradient m and intercept c in y = mx + c, and interpret them in terms of the chemistry (a rate constant, an enthalpy change, a proportionality).
- Percentage error = uncertainty ÷ value × 100, with the uncertainty of a difference being the sum for both readings.
- Give calculated values to the significant figures the data justify.
🔎Conclusions and evaluation
Conclusion: state what the data show, describe the key features (a straight line through the origin, a levelling off), say whether they support the prediction, and explain them with theory. Decide whether a difference from the expected value could be accounted for by the measurement uncertainty, or points to another factor.
Evaluation asks how far the conclusion can be trusted:
- Anomalies: identify them, suggest a cause (a timing error, a temperature change, impure reagent) and say what to do (repeat that reading; exclude it from the line).
- Replication: were readings repeated, and did repeats agree?
- Range: is it wide enough, and are there enough points (and where the curve changes, enough close together)?
- Control of variables: from the information given, were they really kept constant?
- Weaknesses of the procedure, and the effect a change of concentration, condition or misused apparatus would have on the results.
- An overall judgement: how reliable are the data, and how much confidence can be placed in the conclusion? Data that lie close to a line of best fit with no anomalies are reliable.
✏️Worked example
[S2O32−] / mol dm−3: 0.040, 0.080, 0.120, 0.160, 0.200
time / s: 125, 62, 30, 31, 25
(a) Identify the independent, dependent and two controlled variables. (b) Calculate 1/time for each, identify the anomaly and explain how you did so. (c) Plotting 1/time against concentration gives a straight line through the origin (excluding the anomaly). Find its gradient and state the conclusion about the order of reaction. (d) The stop-clock reads to 1 s. Calculate the percentage error in the shortest time, and suggest an improvement to the method. (e) Identify one safety hazard and a precaution.
(a) Independent: concentration of thiosulfate. Dependent: time for the cross to disappear (converted to rate ∝ 1/t). Controlled (any two): temperature, concentration and volume of HCl, total volume (by diluting with water), the same cross and flask.
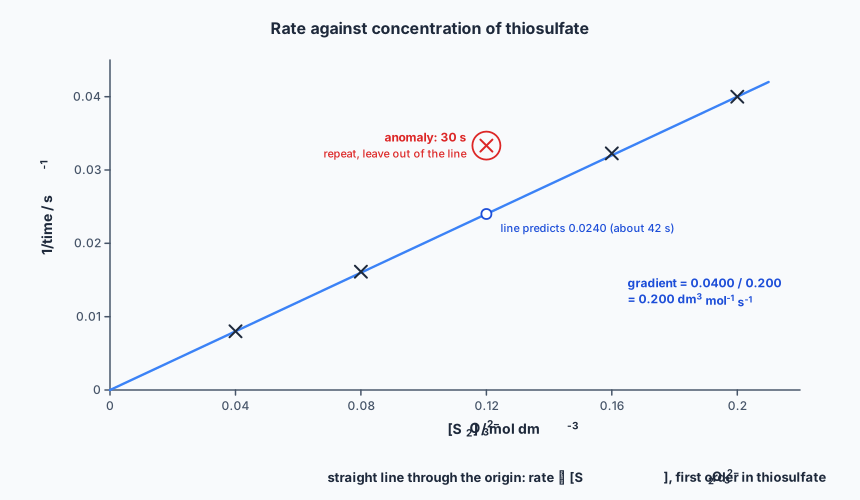
(b) 1/t / s−1: 0.0080, 0.0161, 0.0333, 0.0323, 0.0400. The other four points lie on a line through the origin with 1/t = 0.200 × concentration: at 0.120 mol dm−3 that predicts 0.0240 (a time of about 42 s). The measured 0.0333 (30 s) is far off the line and even larger than the value at 0.160, so 0.120 mol dm−3 is anomalous. It should be repeated and excluded from the line.
(c)
A straight line through the origin means rate ∝ [S2O32−], so the reaction is first order with respect to thiosulfate, as predicted.
(d) The uncertainty is ±1 s in 25 s: 1/25 × 100 = 4%, but the larger error is in judging the end-point by eye. Improvement: use a light sensor or colorimeter to detect a fixed drop in light transmission, removing the subjective judgement; and repeat each concentration and take a mean.
(e) The reaction produces sulfur dioxide, which is toxic and an irritant: work in a fume hood or well-ventilated room, and dispose of the mixture promptly.
📝Practise
Work through these, then reveal the answer. Each question targets a different skill from the list above.
1. Describe how to make 250 cm3 of a standard solution of sodium carbonate.
2. A student plans to investigate how temperature affects the rate of reaction of magnesium ribbon with acid. Identify the variables and write a prediction.
3. A plot of y against x gives a straight line through (0.10, 3.4) and (0.50, 11.4). Find m and c.
4. Give three features of a set of data that would make you confident in a conclusion drawn from it.
5. In an enthalpy experiment, the calculated ΔH is 20% less exothermic than the data-book value, and the percentage error from the apparatus is 3%. What does this tell you?
6. A plan uses hexane as a solvent and heats it with a Bunsen burner. Identify the hazard and suggest a safer method.
🔗Go deeper — other people’s work
These are external resources, not mine. If one stops working, tell me and everything above it on this page still stands.
- The 9701 syllabus, section 5 — the full list of expectations for Paper 5, which the questions are built from.
- Past Paper 5 questions and examiner reports — the best practice there is; the reports say exactly which planning details candidates leave out.
- Royal Society of Chemistry — practical guides for standard solutions and rates experiments.