Reaction kinetics
🎯What you need to be able to do
- Explain and use the terms rate of reaction, frequency of collisions, effective and non-effective collisions.
- Explain, in terms of the frequency of effective collisions, how concentration and pressure affect rate.
- Calculate a rate of reaction from experimental data.
- Define activation energy as the minimum energy for a collision to be effective.
- Sketch the Boltzmann distribution and use it to explain the importance of activation energy and the effect of temperature on rate.
- Explain catalysis as an alternative mechanism of lower activation energy, show it on a Boltzmann distribution and on a reaction pathway diagram, and distinguish homogeneous from heterogeneous catalysts.
📚The chemistry
8.1 Rate of reaction
The rate of reaction is the change in the amount or concentration of a reactant or product per unit time. For concentrations it is measured in mol dm−3 s−1; experimentally you may meet cm3 s−1 (gas collected) or g s−1 (mass lost).
For a reaction to happen, particles must collide. The frequency of collisions is the number of collisions per unit time. Most collisions achieve nothing: the particles bounce apart unchanged. These are non-effective collisions. An effective collision is one that leads to reaction, and it needs enough energy (at least the activation energy) and, for many reactions, the right orientation. The rate depends on the frequency of effective collisions — that phrase is what every rate explanation must reach.
- Concentration. Raising the concentration of a solution puts more particles in the same volume, so they collide more frequently. The proportion of collisions that are effective is unchanged, so the frequency of effective collisions rises and so does the rate.
- Pressure (gases). Raising the pressure squeezes the same number of molecules into a smaller volume — it is the same as raising their concentration, with the same effect.
Surface area works the same way for a solid: powder exposes more particles to collision than lumps do.
Measuring a rate from data
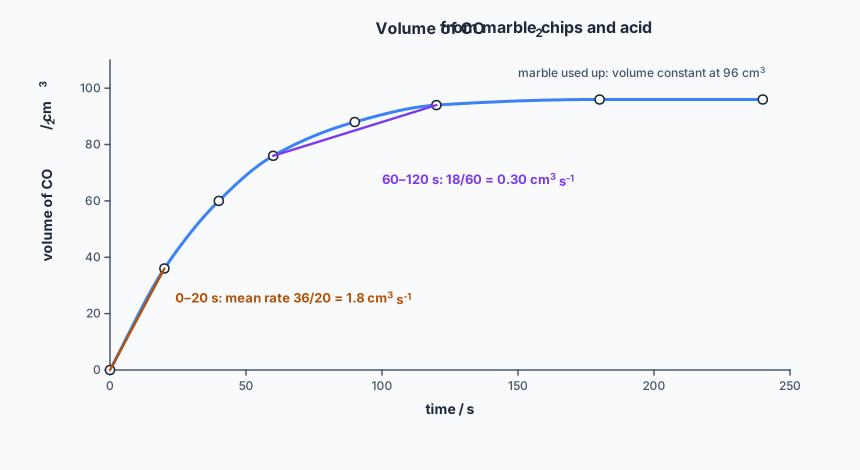
Follow a quantity that changes as the reaction goes: gas volume in a syringe, mass lost as gas escapes, a colour change in a colorimeter, the time for a cross to disappear under a precipitate. Plot it against time. The rate at any moment is the gradient of the curve there — for a curve, the gradient of a tangent. The initial rate, the gradient at t = 0, is the most useful, because only then are the concentrations the values you set. A mean rate over an interval is simply change ÷ time.
Where the time for a fixed amount of reaction is measured (the disappearing cross, a colour appearing), the rate is proportional to 1/time.
8.2 Temperature and activation energy
Activation energy, EA, is the minimum energy required for a collision to be effective. It is the barrier on the reaction pathway diagram in topic 5.
The Boltzmann distribution
At any temperature the molecules of a gas have a range of energies. The Boltzmann distribution plots the number of molecules (y-axis) against their energy (x-axis). Sketch it with these features, because each one is marked:
- it starts at the origin — no molecules have zero energy;
- it rises to a peak (the most probable energy), then falls with a long tail;
- it is not symmetrical;
- the tail approaches the energy axis but never meets it — there is no maximum energy;
- the area under the curve is the total number of molecules.
Mark EA as a vertical line well out on the right. The area under the curve to the right of EA is the number of molecules with enough energy to react. It is a small fraction of the total, which is why most collisions are non-effective.
Why temperature matters so much
At a higher temperature the curve flattens and shifts to the right: the peak is lower and at a higher energy, and the area under the curve is unchanged (the same number of molecules). Two things now raise the rate:
- the molecules move faster, so they collide more often;
- much more importantly, a far greater proportion of molecules have energy ≥ EA — the area beyond EA grows a lot — so a greater proportion of collisions are effective.
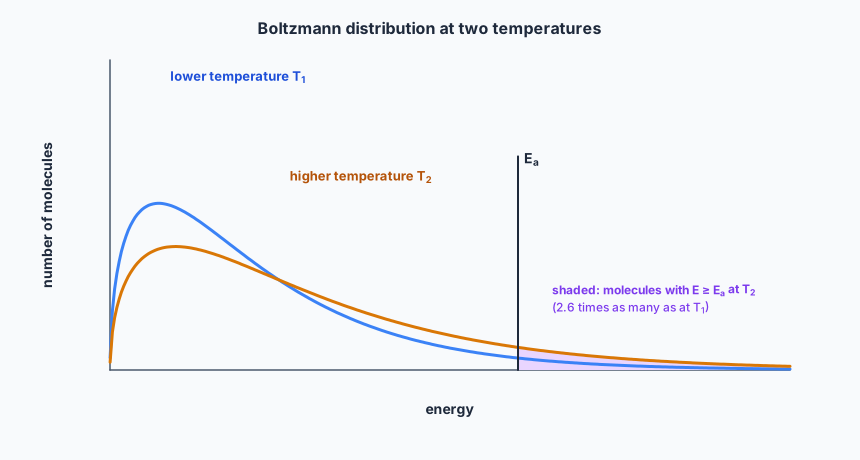
The result is a large increase in the frequency of effective collisions. The second effect dominates, which is why a rise of only 10 K often roughly doubles the rate of a reaction, far more than the slightly more frequent collisions could explain.
8.3 Catalysts
A catalyst increases the rate of a reaction without being used up; catalysis is the process. A catalyst works by providing a different mechanism — an alternative route with a lower activation energy. It is chemically unchanged at the end, though it may take part in intermediate steps.
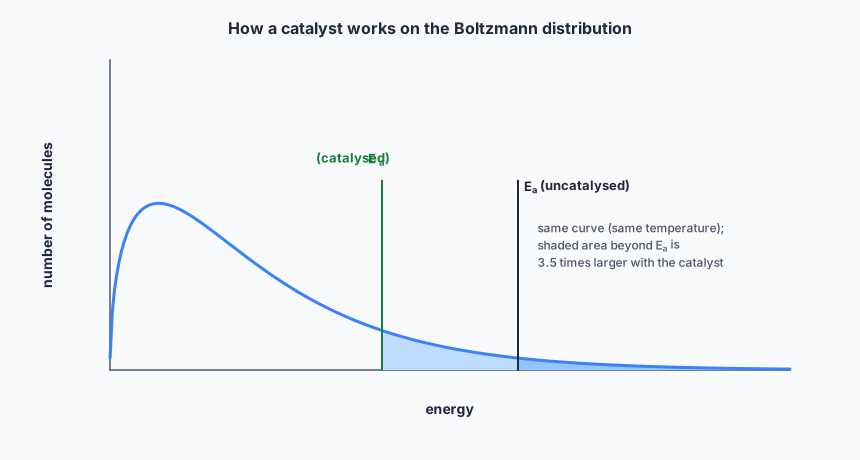
- On a Boltzmann distribution, the curve is unchanged (the temperature has not changed), but EA moves to the left. The area beyond the new, lower EA is larger: a greater proportion of molecules have enough energy to react, so the frequency of effective collisions rises.
- On a reaction pathway diagram, draw the catalysed route between the same reactant and product levels with a lower peak. ΔH is unchanged; EA is smaller. A catalysed pathway sometimes has two smaller humps, one for each step of the new mechanism.
Catalysts come in two kinds:
- Homogeneous — in the same phase as the reactants. Aqueous H+ ions catalysing the esterification of an acid and an alcohol in solution; gaseous nitrogen oxides catalysing the oxidation of sulfur dioxide in the atmosphere.
- Heterogeneous — in a different phase, usually a solid catalysing a reaction of gases or liquids. Iron in the Haber process; vanadium(V) oxide in the Contact process; platinum and rhodium in a car’s catalytic converter. The reaction happens on the solid’s surface, so these catalysts are used as powders, meshes or coatings with a large surface area.
A catalyst does not change the position of equilibrium or the yield (see topic 7); it lets a process reach equilibrium faster, or run at a lower temperature, which saves energy.
✏️Worked example
time / s: 0, 20, 40, 60, 90, 120, 180, 240
volume of CO2 / cm3: 0, 36, 60, 76, 88, 94, 96, 96
(a) Calculate the mean rate of reaction in the first 20 s, in cm3 s−1 and in mol s−1. (b) Calculate the mean rate between 60 s and 120 s, and explain why it is lower. (c) The experiment is repeated 10 °C hotter. Use the Boltzmann distribution to explain why the initial rate increases.
(a)
Convert with the molar volume, 24 000 cm3 mol−1: 1.8 / 24 000 = 7.5 × 10⁻⁵ mol s−1 of CO2.
(b)
As the reaction proceeds the acid is used up (and the chips get smaller), so the concentration of acid falls. There are fewer acid particles in each unit volume, so collisions with the marble surface are less frequent, and the frequency of effective collisions falls. The reaction stops at 96 cm3 when the marble is used up (the acid was in excess).
(c) At the higher temperature the Boltzmann curve is lower at its peak and shifted to higher energies, with the same area underneath. The activation energy is unchanged, so the area under the curve beyond EA is larger: a greater proportion of acid particles have energy at least equal to EA. The particles also move faster and collide slightly more often. Both increase the frequency of effective collisions, and the first effect is the main one, so the initial rate increases significantly.
📝Practise
Work through these, then reveal the answer. Each question targets a different objective from the list above.
1. Explain, in terms of collisions, why increasing the pressure increases the rate of the reaction 2NO(g) + O2(g) → 2NO2(g).
2. The concentration of a reactant falls from 0.500 to 0.380 mol dm−3 in the first 40 s of a reaction. Calculate the mean rate of reaction over this time, with units.
3. Sketch the Boltzmann distribution for a gas at temperature T1, and on the same axes at a higher temperature T2. Mark EA and indicate the molecules able to react at T2.
4. Use a Boltzmann distribution to explain how a catalyst increases the rate of a reaction.
5. Classify each catalyst as homogeneous or heterogeneous: (a) iron in N2(g) + 3H2(g) ⇌ 2NH3(g); (b) H+(aq) in the hydrolysis of an ester in aqueous solution; (c) platinum in a catalytic converter removing CO(g) and NO(g).
6. A student investigates the effect of temperature on the reaction of sodium thiosulfate with hydrochloric acid by timing how long it takes for a cross under the flask to disappear. At 20 °C it takes 80 s; at 30 °C, 42 s. Calculate a relative rate for each, and comment.
🔗Go deeper — other people’s work
These are external resources, not mine. If one stops working, tell me and everything above it on this page still stands.
- PhET — Reactions & Rates, which shows effective and non-effective collisions and a live energy distribution as you change the temperature
- Chemguide (Jim Clark) — the rates section, with careful Boltzmann distribution diagrams for temperature and catalysts
- Royal Society of Chemistry — the practical guides for the thiosulfate “disappearing cross” and marble-chip rate experiments