Practical papers: Paper 5 and Paper 6
🎯What you need to be able to do
- Use apparatus safely, take readings to the right precision and record them in a properly headed table.
- Draw graphs to the syllabus rules, and interpolate, find gradients and spot anomalous results.
- Make clear line drawings of specimens and calculate magnification or actual size.
- Plan an investigation: variables, control, range, repeats, safety; evaluate a method and suggest improvements.
📚The two papers
Everyone takes one practical paper; both are worth 20%, test only AO3 (experimental skills and investigations) and cover grades A*–G, so Core and Extended candidates sit the same one.
Both need the same skills and the same experimental contexts: measuring volumes, masses, temperatures, times and lengths; diffusion and osmosis; food tests; enzyme rates (including judging an end-point from a colour change); pH with hydrogencarbonate indicator, litmus and universal indicator; photosynthesis; transpiration; heart and breathing rate; respiration; tropic responses; seeds and flowers; germination; variation; sampling; and drawing specimens. Paper 6 candidates should still do these experiments in class — the paper rewards people who have.
Readings and precision
- Thermometers in the syllabus list have 1 °C graduations: record whole degrees (24 °C), not 24.35 °C.
- Rulers are graduated in mm: measure to the nearest mm. Stop-clocks read to 1 s. Balances to at least 0.1 g.
- Measuring cylinders and syringes: read the bottom of the meniscus at eye level; choose the smallest one that holds the volume.
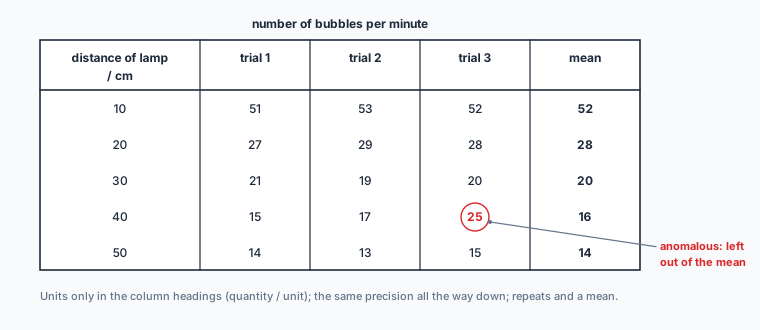
- Keep the same number of decimal places down a column, matching the instrument.
Results tables
Graphs
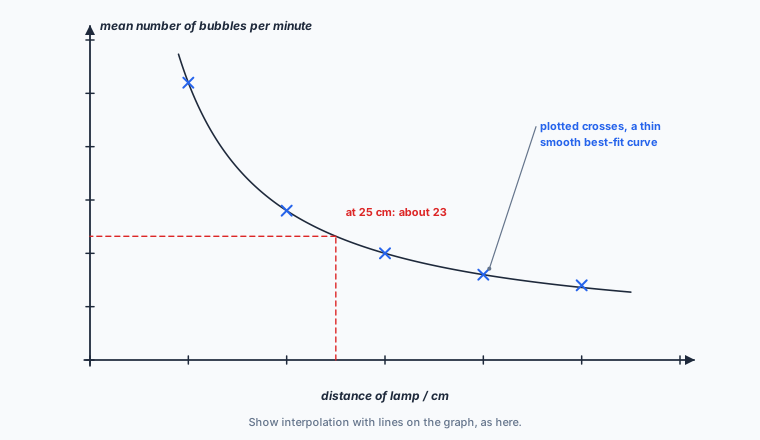
- Independent variable on the x-axis, dependent on the y-axis, each labelled like the table heading (distance of lamp / cm).
- Scales must use more than half the grid in both directions, with sensible steps (2 cm = 1, 2 or 5 units). The axes need not start at 0.
- Plot to within half a small square, with a sharp pencil. Draw a best-fit line only if intermediate values can be predicted; ignore clearly anomalous points.
- Use a bar chart (bars not touching) for categories, a histogram (bars touching) for continuous data, and a pie chart for proportions.
Biological drawings
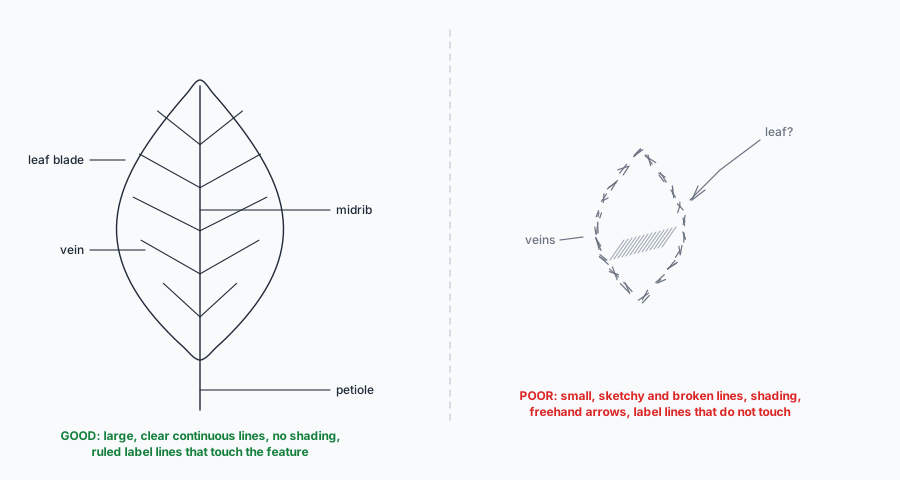
- Sharp pencil, clear continuous lines, no shading or colour; use most of the space provided.
- Show the features you can see, in the right proportions; include structures inside the outline if they are visible.
- Label lines ruled, not crossing each other, touching the feature, with no arrowheads.
Magnification
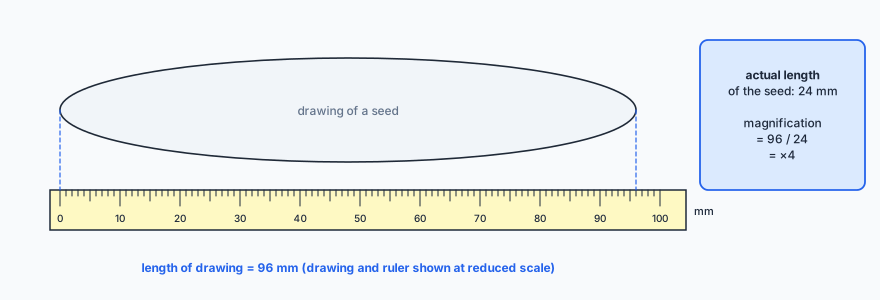
Both lengths must be in the same units. Magnification has no units; write it as ×4. To find the actual size, rearrange: actual size = image size ÷ magnification.
Planning an investigation
- State the independent variable (what you change) and how you change it, with at least five values over a sensible range.
- State the dependent variable (what you measure) and how: the apparatus and the units.
- List the controlled variables and how each is kept constant (a water bath for temperature, a buffer for pH, a measuring cylinder for volume).
- Describe a control where needed (boiled enzyme, no leaf, distilled water) to show the effect is caused by the independent variable.
- Do repeats (at least three) and calculate a mean, to make the results more reliable and show up anomalies.
- Identify risks and precautions: eye protection with chemicals, care with hot water baths and scalpels (cut away from you, on a tile).
- Say how you will record (a table) and process the results (mean, rate, graph), and what result would support the prediction.
Food tests (topic 4)
Evaluating
Sources of error should be specific to the experiment: “the end-point colour was hard to judge”, “the temperature was not controlled”, “bubbles differ in size”, “only one leaf was used”. Each improvement should answer one of them: compare with a colour standard, use a water bath, collect the gas in a syringe and measure its volume, use more leaves and calculate a mean. “Human error” and “be more careful” score nothing.
✏️Worked example
(a) It is anomalous: much higher than the other two repeats (15 and 17) and above the value at 30 cm, which does not fit the trend. Mean \( = \tfrac{15 + 17}{2} = 16 \).
(b) About 23 bubbles per minute (reading lines drawn on the graph from 25 cm).
(c) Keep constant: temperature of the water (a heat shield or water bath, since the lamp warms it), or the concentration of hydrogencarbonate (carbon dioxide). Improvement: collect the gas in a gas syringe or measuring cylinder and measure its volume, because bubbles vary in size.
(d) \( \tfrac{72}{18} = \times 4 \).
📝Practise
In the style of Paper 5 and Paper 6.
1. (Practical.) A thermometer reads between 36 °C and 37 °C, nearer 37. How should the temperature be recorded? [1]
2. (Practical.) A student records times of 45, 1 min 12 s and 98 s in a column headed “Time”. Give three ways to improve this column. [3]
3. (Practical.) Should a bar chart or a histogram be used for (a) the number of each colour of flower in a field, (b) the lengths of 50 leaves? [2]
4. (Practical.) A photograph of an insect is shown at ×6. The image is 54 mm long. Calculate the actual length of the insect. [2]
5. (Practical.) Plan an investigation into the effect of temperature on the time taken for amylase to digest starch. [6]
6. (Practical.) In an osmosis experiment, potato cylinders were blotted dry before weighing on some occasions but not others. Explain why this is a source of error and how to improve it. [2]
🔗Go deeper — other people’s work
These are external resources, not mine. If one stops working, tell me and everything above it on this page still stands.
- Cambridge International — the 0610 syllabus section “Practical assessment” and “Presentation of data”
- ASE — The Language of Mathematics in Science (graphs, tables and units)