What is economics?
🎯What you need to be able to do
- Explain why economics is a social science, and distinguish microeconomics from macroeconomics.
- Name and use the nine key concepts: scarcity, choice, efficiency, equity, economic well-being, sustainability, change, interdependence and intervention.
- Identify the four factors of production and their rewards, and explain scarcity, opportunity cost and free goods.
- Explain the basic economic questions and how free market, planned and mixed economies answer them.
- Draw and use a PPC to show scarcity, choice, opportunity cost, unemployment, efficiency, actual growth and growth in production possibilities, and explain constant versus increasing opportunity cost.
- Draw the circular flow of income with households, firms, government, the financial sector and the foreign sector, and explain leakages and injections.
📚The economics
Economics as a social science
Economics studies how people, firms and governments choose to use scarce resources to satisfy their needs and wants. It is a social science because its subject is human behaviour: people interact in markets, respond to incentives, follow habits and change their minds. Unlike a chemist, an economist cannot hold everything else constant in a laboratory, so economics relies on models, logic and the careful reading of real-world data.
studies individual decision-makers and markets: consumers, firms, workers, and the market for one good such as rice or smartphones. Unit 2.
studies the economy as a whole: total output (GDP), unemployment, inflation, growth and government policy. Unit 3 and much of Unit 4.
The nine key concepts
The IB course is organized around nine concepts. They are not a separate topic: they are lenses you use in every unit, and each IA commentary must be built around a different one.
Resources are limited relative to unlimited wants.
Scarcity forces choices, and every choice has an opportunity cost.
Getting the most out of scarce resources: no waste, and producing what society values most.
Fairness, which is a value judgment; not the same as equality.
Living standards, economic security and the ability to meet needs, not just income.
Meeting present needs without damaging the ability of future generations to meet theirs.
Economies are dynamic: tastes, technology, prices and policies shift.
Decision-makers and countries rely on one another; a change in one place spreads.
Government action in markets, from taxes and subsidies to regulation and provision.
The problem of choice: factors of production
Goods and services are produced using four factors of production, each earning its own reward:
All natural resources: soil, minerals, forests, fish, water. Bali’s beaches are “land” for its tourism industry.
Human effort, physical and mental. Its quality depends on education, training and health (human capital).
Man-made aids to production: machines, buildings, roads, computers. Not money itself.
Organizing the other three factors and taking the risk of a business.
Scarcity is the situation where human needs and wants are unlimited but the resources to satisfy them are limited. It applies to the richest person as much as to the poorest: nobody has unlimited time. Scarcity also links to sustainability: using finite resources such as fish stocks, forests or fossil fuels faster than they renew makes them scarcer for future generations.
Opportunity cost and free goods
Opportunity cost is the value of the next best alternative forgone when a choice is made. A government that spends Rp 10 trillion on a new toll road cannot spend the same money on hospitals; if hospitals were the next best use, the hospitals are the opportunity cost of the road. Opportunity cost is measured in what is given up, not in money.
A free good has zero opportunity cost: it is so plentiful that using it takes nothing from anyone else. Air in an open field and sunlight are the standard examples. Most things that are “free” to the user, such as a free school meal, are not free goods: resources were used to produce them, and someone paid.
The basic economic questions
Because resources are scarce, every society must answer three questions:
- What and how much to produce? More rice or more palm oil? More schools or more roads?
- How to produce? With lots of labour (hand-harvesting) or lots of capital (machines)?
- For whom to produce? Who gets the output: whoever can pay, or whoever needs it?
Private individuals and firms own resources; prices answer the questions. Efficient and responsive, but can leave some people with very little and ignore pollution.
The state owns resources and decides what is made, how and for whom. Can prioritize equity, but struggles with information and incentives, leading to shortages and waste.
Markets allocate most resources, but the government provides some goods, redistributes income and regulates. Every real economy, including Indonesia, is mixed; they differ in the mix.
The production possibilities curve (PPC)
A PPC shows the maximum combinations of two goods an economy can produce when it uses all its resources efficiently, with a given state of technology, over a given period.
Assumptions: only two goods are produced; the quantity and quality of resources are fixed; technology is fixed; all resources are fully and efficiently employed at points on the curve.
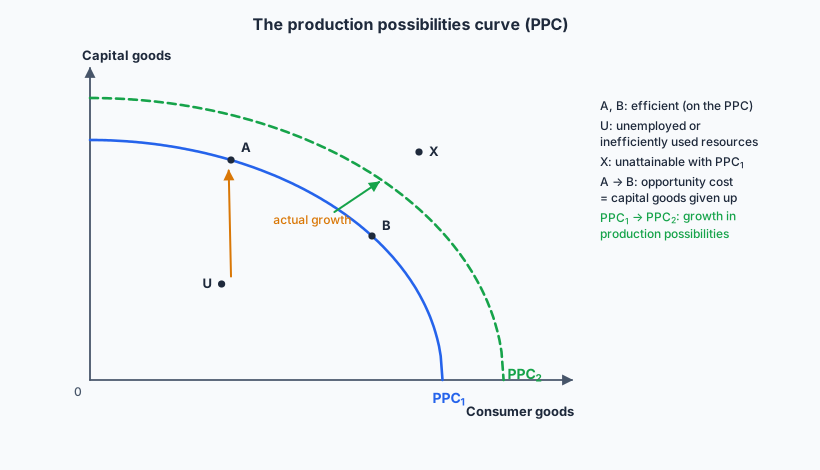
- Scarcity: points outside the curve (X) cannot be reached with current resources.
- Choice and opportunity cost: moving from A to B gives more consumer goods but fewer capital goods; the capital goods given up are the opportunity cost.
- Efficiency: every point on the curve uses all resources fully (productive efficiency).
- Unemployment of resources: a point inside the curve (U) means resources are idle or used inefficiently, for example in a recession.
- Actual growth: a movement from inside towards the curve (U to A), as idle resources are brought back into use. Output rises but the curve does not move.
- Growth in production possibilities: an outward shift of the whole curve (PPC1 to PPC2), caused by more or better resources or improved technology.
Choosing more capital goods today (point A rather than B) means less consumption now, but more machines and infrastructure raise productive capacity, so the PPC shifts out faster in future. This is the classic trade-off between present and future living standards.
Constant versus increasing opportunity cost
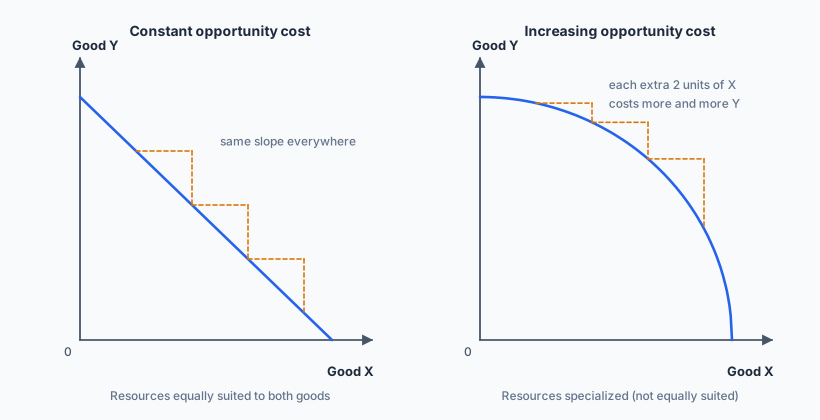
A straight-line PPC means resources are equally suited to producing both goods, so each extra unit of X always costs the same amount of Y. A concave PPC is more realistic: resources are specialized. The first resources moved into X production are the ones best suited to it and worst at Y, so little Y is lost; as production of X expands, less suitable resources must be moved, and the opportunity cost of each extra unit of X rises.
Modelling the economy: the circular flow of income
The circular flow of income model shows how money and real resources move between the economy’s decision-makers, which is why national income can be measured in three equivalent ways (3.1).
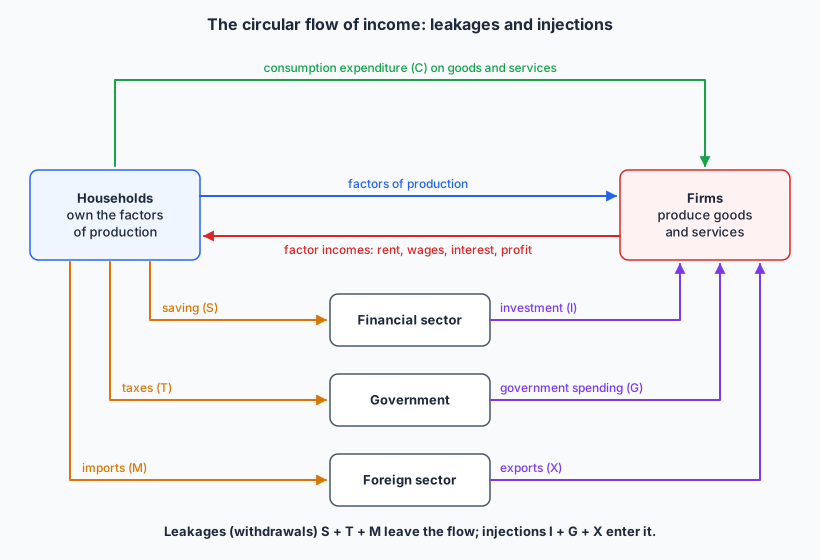
- Households own the factors of production and sell their services to firms, receiving factor incomes (rent, wages, interest, profit).
- Households spend income on goods and services: consumption (C), which becomes firms’ revenue.
- Leakages (withdrawals) take income out of the flow: saving (S) into banks, taxes (T) to the government, and imports (M) to foreign producers.
- Injections add spending into the flow: investment (I) by firms (often financed by borrowing saved funds), government spending (G) and exports (X) bought by foreigners.
The flow of income grows: national income rises.
The flow of income shrinks: national income falls.
I + G + X = S + T + M: national income is at an equilibrium level.
The model shows interdependence: if households in Australia cut spending on holidays, Bali’s exports of tourism services fall, hotel workers’ incomes fall, and their spending on local goods falls in turn.
✏️Worked example
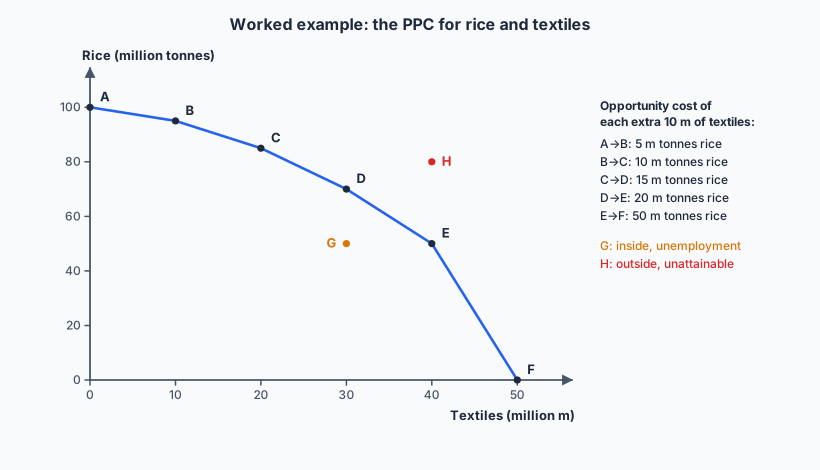
A, B, C, D, E, F
0, 10, 20, 30, 40, 50
100, 95, 85, 70, 50, 0
(b) Explain what the results show about the shape of the PPC.
(c) The economy is producing 30 million m of textiles and 50 million tonnes of rice (point G). Explain what this shows.
(d) Can it produce 40 million m of textiles and 80 million tonnes of rice (point H)? Explain.
(a) Opportunity cost = rice given up for each extra 10 million m of textiles:
(All in million tonnes of rice.) Each extra 10 million m of textiles costs more rice than the last.
(b) The opportunity cost of textiles increases as more are produced, so the PPC is concave (bowed outwards). Resources are not equally suited to both goods: the last land and labour switched to textiles are those best at growing rice.
(c) Point G lies inside the PPC: with 30 million m of textiles, the economy could produce 70 million tonnes of rice (point D). 20 million tonnes of rice are lost because resources are unemployed or inefficiently used. Moving from G to D would be actual growth with no opportunity cost.
(d) No. With 40 million m of textiles the maximum rice output is 50 million tonnes (point E). Point H lies outside the PPC, so it is unattainable with current resources and technology; it would need an outward shift of the PPC.
📝Practise
Work through these on paper, then reveal the answer. Questions labelled with a paper are written in the style of real IB questions from recent sessions; the wording, numbers and contexts are ours.
1. [2 marks, Paper 2 style] Define the term opportunity cost.
2. Explain why a sunny beach may be a free good to a local resident but not to a hotel that builds on it.
3. [4 marks, Paper 2 style] Using a PPC diagram, explain the likely effect of a recession on an economy’s output.
4. [4 marks, Paper 2 style] Using a PPC diagram, explain how an improvement in education might affect an economy.
5. Explain what happens to national income when the government raises taxes and cuts spending at the same time, all else equal.
6. [10 marks, Paper 1 style (a)] Explain how a free market economy and a planned economy answer the basic economic questions.
Plan for a top-band answer. Define scarcity and the three basic questions (what/how much, how, for whom). Then compare the two systems question by question:
What to produce: in a free market, consumers’ spending signals what they want, and firms follow the profit incentive; in a planned economy, planners decide, often by output targets. How: firms choose the cheapest method, so relative factor prices decide between labour and capital; planners allocate inputs directly. For whom: in a market, goods go to those willing and able to pay, so the distribution follows income; planners distribute according to their priorities, such as need.
Use a diagram: the PPC (choice and opportunity cost) or a demand and supply diagram showing prices rationing a good. Add a real example of each (most modern economies are mixed, so name an economy nearer each end). Paper 1 part (a) rewards accurate theory, a relevant diagram explained in the text, and consistent use of terms; evaluation is not needed in part (a).
🔗Go deeper — other people’s work
These are external resources, not mine. If one stops working, tell me and everything above it on this page still stands.
- CORE Econ, The Economy — a free online textbook whose first chapters cover scarcity, choice and the history of capitalism with real data.
- Khan Academy — Production possibilities frontier videos, with clear worked PPC examples.
- Econlib’s Concise Encyclopedia of Economics — short, readable entries on opportunity cost and economic systems.