Measuring development
🎯What you need to be able to do
- Explain the multidimensional nature of economic development.
- Explain single indicators: GDP/GNI per capita at PPP, health, education, economic and social inequality, energy and environmental indicators.
- Explain composite indicators: the Human Development Index (HDI), Gender Inequality Index (GII), Inequality-adjusted HDI (IHDI) and the Happy Planet Index.
- Evaluate approaches to measuring development, and discuss the possible relationship between economic growth and economic development.
📚The economics
What is economic development?
Economic growth is an increase in real output (GDP). Economic development is a multidimensional improvement in people’s well-being: rising incomes, less poverty and inequality, better health and education, more freedom and choice, and greater self-esteem and security. Amartya Sen described development as the expansion of people’s capabilities: the real freedoms they have to live the lives they value. Denis Goulet’s three core values are life sustenance (basic needs), self-esteem and freedom.
Single indicators
- GDP or GNI per capita at PPP: average income adjusted for the cost of living (3.1). Widely available and comparable, but an average that ignores distribution and non-income dimensions.
- Health indicators: life expectancy at birth, infant and under-5 mortality, maternal mortality, share of stunted children, doctors per 1000 people.
- Education indicators: literacy rates, mean and expected years of schooling, enrolment rates, learning outcomes (test scores).
- Economic and social inequality indicators: the Gini coefficient, income share of the richest 10% or poorest 40%, the poverty rate.
- Energy indicators: access to electricity, use of clean cooking fuels, energy use per person.
- Environmental indicators: CO2 emissions per person, forest cover, air quality (PM2.5), access to clean water and sanitation, the ecological footprint.
Single indicators are simple and precise, but each captures only one dimension; they can move in different directions.
Composite indicators
UNDP, from 1990. Combines three dimensions: health (life expectancy), education (mean years of schooling for adults and expected years of schooling for children) and standard of living (GNI per capita at PPP, in logs). Each is converted to an index from 0 to 1, and the HDI is their geometric mean. Indonesia’s HDI is in the “high” category, a little above 0.7.
measures the loss in achievement caused by gender inequality in reproductive health (maternal mortality, adolescent birth rate), empowerment (share of parliamentary seats, secondary education) and the labour market (participation rates). 0 = equality; higher = more inequality.
the HDI discounted for inequality within each dimension. If everyone were equal, IHDI = HDI; the gap between them is the “loss” due to inequality. Shows that average achievement can hide very unequal distribution.
combines well-being (life satisfaction) and life expectancy, adjusted for inequality, divided by the ecological footprint. Rewards countries that deliver long, happy lives with few resources; many rich countries rank low.
Strengths and limitations
- Composite indicators capture several dimensions in one number, allow rankings and comparisons over time, and draw attention to health and education, not just income. But they involve value judgments about which dimensions to include and how to weight them; they can hide trade-offs between dimensions; data quality varies; and a single number cannot capture freedom, security or culture.
- Single indicators are clearer to interpret and easier to target with policy, but partial.
- Averages hide inequality between regions, genders and groups (why IHDI and GII exist).
- Data in low-income countries are often old, estimated, or miss the informal economy and remote areas.
Growth and development
- Growth can support development: higher incomes fund food, housing and schooling; growing tax revenue pays for health, education and infrastructure; growth creates jobs and can reduce poverty. Countries with higher GDP per capita generally have higher HDI.
- Growth without development: if the gains go to a small elite, if growth is based on extracting resources with few jobs (some oil exporters), if it damages the environment and health, or if governments do not invest the revenue, growth may improve few lives. Some countries have HDI ranks far below their income ranks.
- Development without much growth: good public health, education and gender policies can raise life expectancy and literacy even at modest incomes (Kerala in India and Sri Lanka are often cited; Costa Rica ranks high on well-being measures).
- Development also supports growth: a healthier, better-educated workforce is more productive (LRAS shifts right).
✏️Worked example
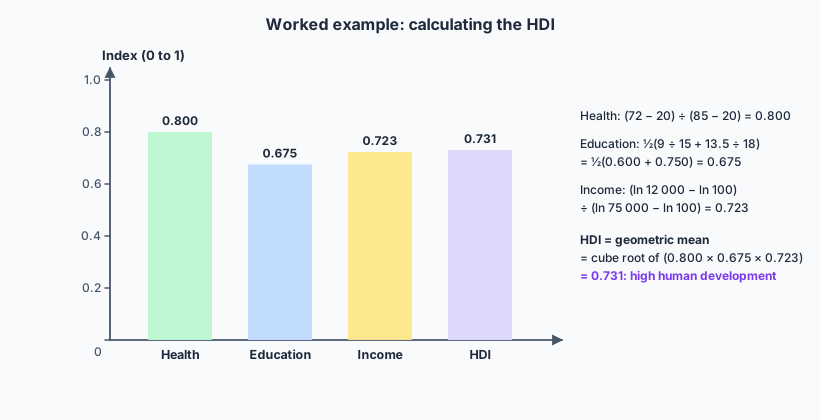
HDI 0.731 falls in the “high human development” band (0.700–0.799). The weakest dimension is education, so policy aimed at schooling would raise the HDI most.
📝Practise
Tagged questions are modelled on a real IB question from that session, with our own wording and context.
1. [2 marks, Paper 2 style] Define the term Human Development Index.
2. Explain why a country’s IHDI is lower than its HDI.
3. [15 marks, Paper 1 (b) — modelled on May 2024 SL Paper 1 Q3(b)] Using real-world examples, evaluate the usefulness of GDP per capita at PPP for comparing development across countries.
For: widely available, timely and comparable (at PPP); income enables access to goods and services; strongly correlated with health and education.
Against: an average that hides distribution; ignores health, education, freedom, gender equality and the environment; misses informal and non-market activity. Examples: resource-rich countries with high income but lower HDI rank; countries with modest incomes but good health outcomes.
Alternatives: HDI, IHDI, GII, MPI, Happy Planet Index, each with its own value judgments. Judgment: GDP per capita is a necessary part of the picture but not the best single measure; a dashboard of indicators is better.
4. [15 marks, Paper 1 (b) — modelled on May 2023 SL Paper 1 Q3(b)] Using real-world examples, examine why rapid growth in some countries has not been matched by improvements in health and education.
5. Explain two limitations of the Gender Inequality Index as a measure of gender inequality.
6. Explain why the Happy Planet Index may rank a middle-income country above a high-income one.
🔗Go deeper — other people’s work
These are external resources, not mine. If one stops working, tell me and everything above it on this page still stands.
- UNDP Human Development Report — HDI, IHDI, GII and MPI data for every country, with technical notes.
- Our World in Data — interactive charts on life expectancy, schooling, income and many other indicators.
- Amartya Sen, Development as Freedom — the classic statement of the capabilities approach.