Role of government in microeconomics
🎯What you need to be able to do
- Explain why governments intervene: to earn revenue, support firms, support low-income households, influence production and consumption, correct market failure and promote equity.
- Explain the main forms of intervention: price controls, indirect taxes (specific and ad valorem) and subsidies, direct provision, and command-and-control regulation.
- Draw diagrams of a price ceiling, a price floor, an indirect tax and a subsidy, and evaluate their consequences for markets and stakeholders.
- HL Explain consumer nudges as a form of intervention.
- HL Calculate the effects on markets and stakeholders of price controls, indirect taxes and subsidies from a diagram.
📚The economics
Why governments intervene
- Earn government revenue: indirect taxes on fuel, tobacco and alcohol raise large sums, especially where demand is inelastic.
- Support firms: subsidies and price floors protect industries seen as strategic (farming, domestic manufacturing) or help new ones start.
- Support households on low incomes: price ceilings on staples and subsidies on fuel or electricity keep essentials affordable.
- Influence the level of production: subsidies to renewable energy or electric vehicle makers expand output; taxes shrink polluting industries.
- Influence the level of consumption: taxes discourage demerit goods (cigarettes, sugary drinks); subsidies encourage merit goods (vaccination, education).
- Correct market failure: externalities, public goods, asymmetric information and market power (2.8–2.11).
- Promote equity: redistribute income and make access fairer.
Price ceilings (maximum prices)
A price ceiling is a legal maximum price, set below the equilibrium price to make a good more affordable. (A ceiling above equilibrium has no effect.) Examples: rent controls; Indonesia’s maximum retail price (HET) for its government-branded cooking oil, Minyakita, introduced during the cooking-oil price spike of 2022; ceilings on rice prices.
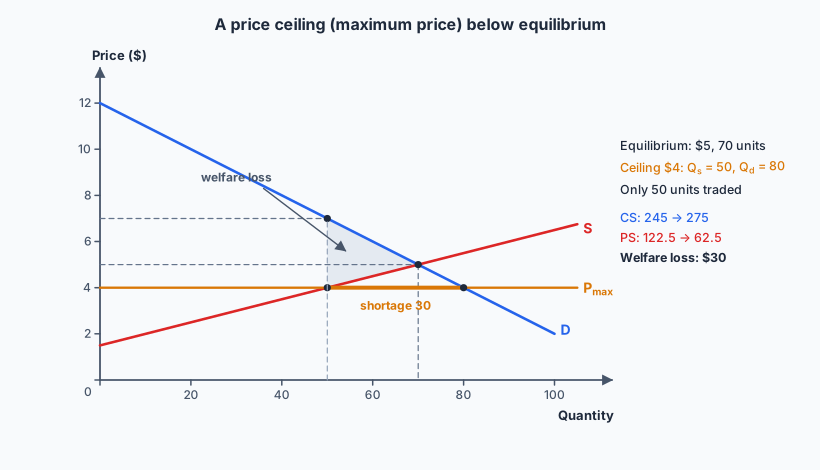
- Shortage: at Pmax, Qd (80) > Qs (50). Only 50 units are traded.
- Non-price rationing: since price cannot ration the good, something else does: queues, first-come-first-served, favouritism, or government rationing (coupons, limits per customer).
- Parallel (black) markets: some buyers will pay more than Pmax, so illegal resale appears. During the 2022 cooking-oil crisis, subsidized oil was hoarded and resold above the ceiling.
- Lower quality / underallocation: producers cut costs, and in rent-controlled housing landlords neglect maintenance.
- Welfare loss: the units between 50 and 70, whose marginal benefit exceeded marginal cost, are no longer produced.
Those who get the good pay less (CS rises from $245 to $275 here), but those who miss out lose; time spent queuing is a cost.
Lower price and lower quantity: PS falls ($122.50 to $62.50). Some firms leave the market.
Gains political popularity; must spend on enforcement; may need to subsidize producers or supply the good itself to fill the gap.
Lower output may mean fewer jobs in the industry.
Price floors (minimum prices)
A price floor is a legal minimum price set above equilibrium, to protect producers’ incomes. Examples: guaranteed farm prices (Indonesia’s government purchase price for unhusked rice, bought by the state logistics agency Bulog, acts as a floor for farmers); the EU’s past agricultural price support; minimum wages, which are a price floor in the labour market (3.3).
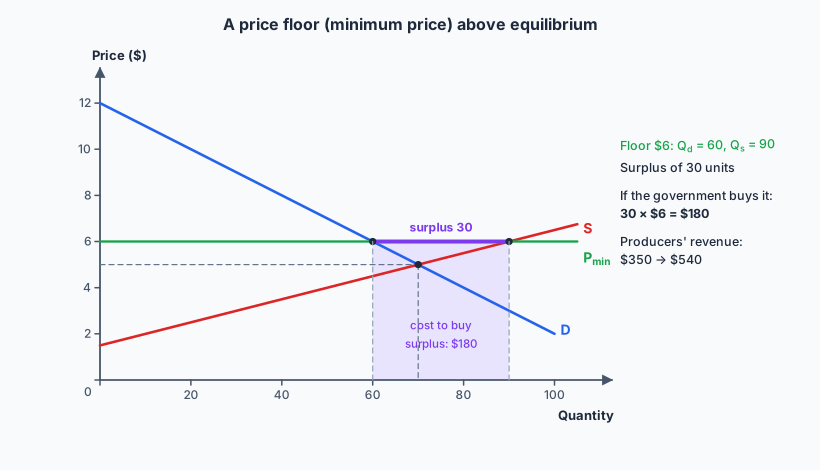
- Surplus: at Pmin, Qs (90) > Qd (60). To keep the price at $6 the government usually buys the surplus: 30 × $6 = $180, plus storage costs. Stockpiles may be destroyed, sold abroad cheaply (“dumping”, harming foreign farmers) or given as aid.
- Inefficiency: resources are drawn into producing output that nobody wants at that price (overallocation), and inefficient producers are protected from competition.
- Consumers pay more and buy less; poorer households are hit hardest if the good is food.
- Producers gain: revenue rises from $5 × 70 = $350 to $6 × 90 = $540 if the government buys the surplus.
- Government bears the cost, with an opportunity cost in other spending, but may gain farmers’ votes and support rural incomes and food security.
Indirect taxes
An indirect tax is a tax on spending on goods and services, paid to the government by the seller.
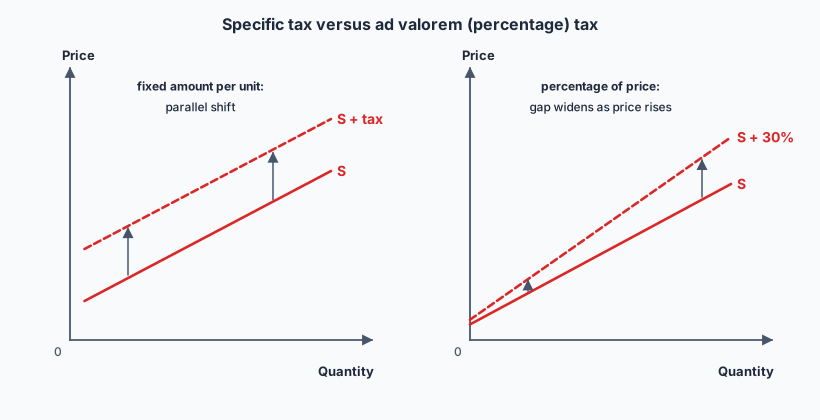
a fixed amount per unit, such as Rp per litre of fuel or per stick of cigarettes. The supply curve shifts up by the amount of the tax, in parallel.
a percentage of the price, such as VAT (Indonesia’s PPN rose to 11% in 2022). The gap between S and S + tax widens as price rises.
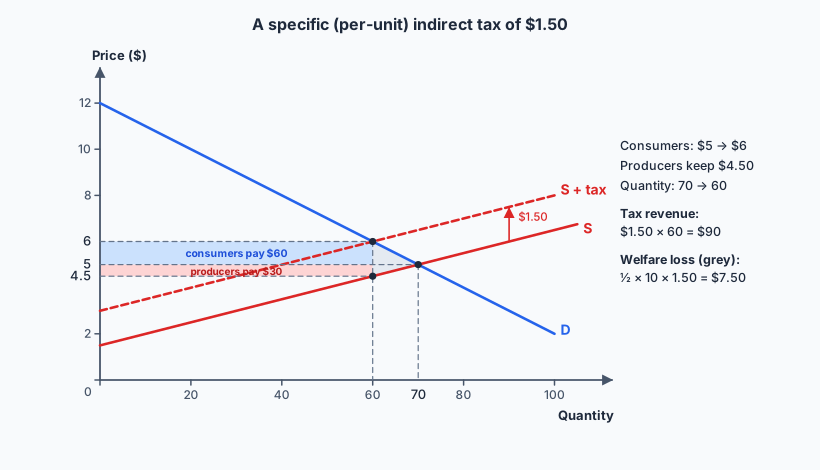
Tax incidence is how the burden is shared. The price consumers pay rises by less than the tax (unless demand is perfectly inelastic). The more inelastic demand is relative to supply, the more of the tax consumers pay; the more inelastic supply is, the more producers pay.
- Consumers: pay a higher price and buy less; consumer surplus falls. Taxes on goods that take a larger share of poor households’ budgets are regressive.
- Producers: receive a lower price per unit and sell less; revenue and producer surplus fall. Workers may lose jobs.
- Government: gains revenue (tax × quantity), which can fund services or offset the regressive effect.
- Society: in a market with no externalities, a welfare loss arises because units with MB > MC are no longer traded. But if the good has a negative externality, the tax can increase welfare by moving output towards the social optimum (2.8).
Subsidies
A subsidy is a payment from the government to producers, usually per unit, to lower costs and increase output. The supply curve shifts down by the subsidy. Examples: Indonesia’s fuel and LPG subsidies, fertilizer subsidies to farmers, incentives for electric motorcycles and cars; renewable energy subsidies worldwide.
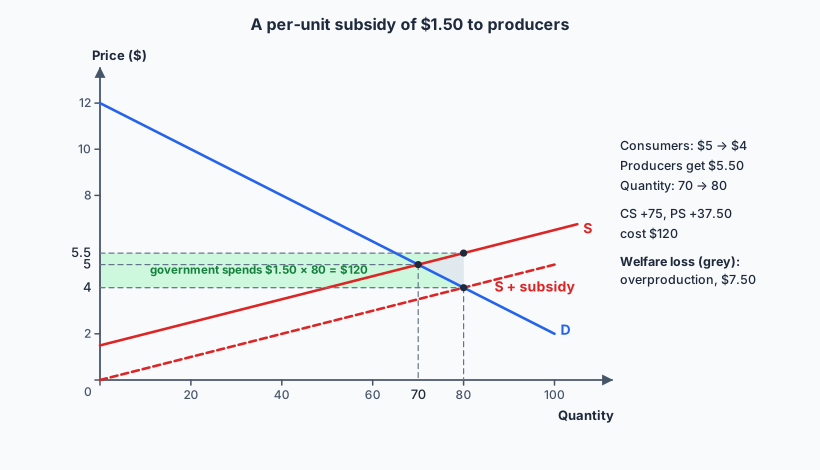
- Consumers: lower price, higher quantity, consumer surplus rises.
- Producers: receive more per unit (price + subsidy), sell more; producer surplus rises; more jobs.
- Government: spends subsidy × quantity, with an opportunity cost: before the 2014–15 reforms, Indonesia’s fuel subsidies cost several times its health budget.
- Society: with no externalities, overproduction causes a welfare loss; with a positive externality (a merit good), the subsidy can raise welfare.
- Foreign producers lose if subsidized domestic firms undercut them (4.2).
Other forms of intervention
- Direct provision of services: the government produces the good itself (state schools, public hospitals, roads, street lighting), usually free or below cost, funded by taxes. Ensures access and equity, but may be inefficient without competition.
- Command and control regulation and legislation: laws that require or forbid behaviour: emission limits, bans on single-use plastics (Bali, 2018), age limits on alcohol and tobacco, food safety standards, compulsory helmet use. Simple and certain, but needs enforcement and gives no incentive to do better than the standard.
- HL Consumer nudges: changing the choice architecture (2.4): default options, placement, reminders and graphic warnings. Cheap and freedom-preserving, but often modest in effect.
✏️Worked example HL
(a) For the $1.50 tax, calculate the government’s revenue, the tax burden on consumers and on producers, the change in consumer and producer surplus, and the welfare loss.
(b) For the $1.50 subsidy, calculate the cost to the government and the change in consumer and producer surplus.
(a) After the tax, Pconsumer = $6, Pproducer = $4.50, Q = 60.
1.50 × 60 = $90
(6 − 5) × 60 = $60
(5 − 4.50) × 60 = $30
Consumer surplus falls from ½ × 70 × 7 = $245 to ½ × 60 × (12 − 6) = $180, a loss of $65. Producer surplus falls from $122.50 to ½ × 60 × (4.50 − 1.50) = $90, a loss of $32.50.
(b) After the subsidy, Pconsumer = $4, producers receive $5.50, Q = 80.
1.50 × 80 = $120
½ × 80 × 8 = $320: +$75
½ × 80 × 4 = $160: +$37.50
The gains to consumers and producers ($112.50) are less than the cost to taxpayers ($120): a welfare loss of $7.50 from overproducing units 71–80.
📝Practise
Tagged questions are modelled on a real IB question from that session, with our own wording, numbers and context.
1. [2 marks, Paper 2 style] Define the term price ceiling.
2. [10 marks, Paper 1 (a) — modelled on May 2022 SL Paper 1 Q1(a)] Explain how a guaranteed minimum price for rice could help farmers, and how a price ceiling on cooking oil could help low-income households.
Support farmers: a price floor (guaranteed minimum price) above equilibrium, with the government buying the surplus; diagram showing Pmin, the surplus and higher farm revenue. Or a subsidy per tonne shifting supply right, raising the price received.
Promote equity: a price ceiling on a staple such as cooking oil or rice so low-income households can afford it (diagram with shortage), or a subsidy on a merit good, or direct provision of free healthcare. Explain why each improves equity: the poor spend a larger share of income on staples.
3. [4 marks, Paper 2 style] Using a demand and supply diagram, explain why a maximum price on rental housing may lead to a shortage.
4. HL [Paper 3 style] Before a tax, 2 million packs of cigarettes are sold per week at $4. A specific tax of $1.20 per pack is imposed; the new consumer price is $5.00 and sales fall to 1.8 million. Calculate (a) tax revenue, (b) the share of the tax paid by consumers and by producers, (c) the change in producers’ revenue.
5. [15 marks, Paper 1 (b) — modelled on May 2024 SL Paper 1 Q1(b)] Using real-world examples, evaluate the use of guaranteed minimum prices to support farmers’ incomes.
Against price floors: surplus, cost of buying and storing it, opportunity cost of the spending; resource misallocation and protection of inefficient producers; higher prices for consumers (regressive for food); dumping surpluses abroad harms farmers in poorer countries (EU butter mountains, historically).
For: stabilizes farmers’ incomes where commodity prices are volatile (low PED and PES, 2.6); food security and rural employment; reduces rural poverty. Minimum wages (a floor in the labour market) can reduce working poverty; minimum unit pricing of alcohol (Scotland, 2018) targets a demerit good.
Evaluate: depends on how far above equilibrium the floor is, elasticities, whether storage is feasible, and the alternatives (direct income support distorts less). “Never” is too strong: well-targeted, modest floors can meet goals that markets ignore. A clear judgment backed by a diagram and two developed examples reaches the top band.
6. [15 marks, Paper 1 (b) — modelled on November 2024 SL Paper 1 Q1(b)] Using real-world examples, discuss the consequences for consumers and producers of a government capping the price of a staple food.
Harms: shortage, non-price rationing, black markets, lower quality, welfare loss, producers exit (with diagram). Example: Indonesia’s Minyakita ceiling saw shortages and hoarding at times; rent controls reduce housing supply over time.
Benefits: consumers who obtain the good gain surplus; affordability of essentials for poor households; can be combined with subsidies or state supply to avoid shortages; in a monopoly market a ceiling can actually raise output (HL, 2.11).
Judgment: “always” fails: effects depend on how far below equilibrium, elasticities, time period (shortages grow as supply responds) and accompanying policies. Temporary ceilings in emergencies may be justified; long-lasting ones usually harm supply.
🔗Go deeper — other people’s work
These are external resources, not mine. If one stops working, tell me and everything above it on this page still stands.
- International Institute for Sustainable Development (IISD) — reports on Indonesia’s fuel subsidy reforms.
- Khan Academy — Price ceilings and floors, Taxation and deadweight loss.
- OECD — Consumption Tax Trends, for VAT and excise rates around the world.