Competitive market equilibrium
🎯What you need to be able to do
- Draw and explain market equilibrium, and show how shifts in demand and supply create excess demand (shortage) or excess supply (surplus) and a new equilibrium.
- Explain the functions of the price mechanism: resource allocation, signalling, incentive and rationing.
- Explain consumer surplus, producer surplus and social/community surplus, with a diagram.
- Explain why the competitive equilibrium is allocatively efficient: social surplus is maximized where marginal benefit equals marginal cost.
- HL Calculate consumer and producer surplus from a diagram.
📚The economics
Market equilibrium
A market is in equilibrium when quantity demanded equals quantity supplied. At the equilibrium price there is no tendency for the price to change: every buyer willing to pay that price finds a seller, and every seller willing to accept it finds a buyer. The market “clears”.
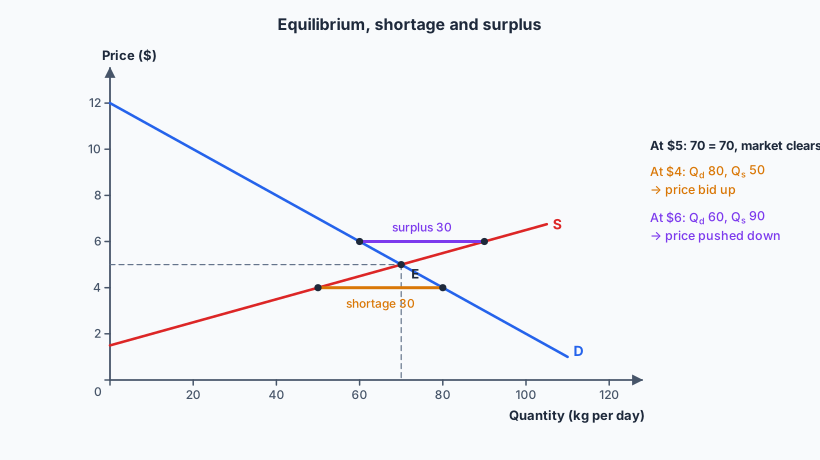
At a price below equilibrium, Qd > Qs. Buyers compete for the limited goods, sellers see queues and empty shelves, and the price is bid up. As it rises, quantity demanded contracts and quantity supplied extends until they are equal.
At a price above equilibrium, Qs > Qd. Unsold stock piles up, so sellers cut prices. As the price falls, quantity demanded extends and quantity supplied contracts until the surplus disappears.
Changes in equilibrium
When a determinant of demand or supply changes, the curve shifts, the old price no longer clears the market, and a shortage or surplus pushes the price to a new equilibrium.
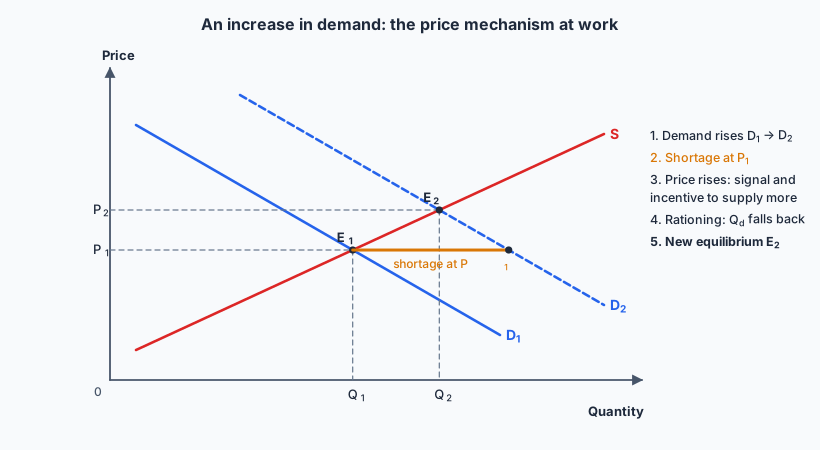
P ↑, Q ↑
P ↓, Q ↓
P ↓, Q ↑
P ↑, Q ↓
If both curves shift, the effect on one variable is certain and on the other depends on the size of the shifts. For example, if demand and supply both increase, quantity certainly rises, but price may rise, fall or stay the same.
The functions of the price mechanism
In a free market nobody decides what to produce; prices do the coordinating. The price mechanism does four jobs at once:
- Signalling. Prices carry information. A rising price signals that a good has become scarcer relative to demand; a falling price signals a surplus. Producers and consumers do not need to know why.
- Incentive. Prices give reasons to act. A higher price makes supplying more profitable, so producers expand output; for consumers it is an incentive to economize or switch to substitutes.
- Rationing. When a good is scarce, the rising price rations it among buyers: those willing and able to pay the most get it, and quantity demanded falls to match what is available.
- Resource allocation. Together these move land, labour and capital towards the goods consumers value most and away from those they value less. When demand for electric vehicle batteries soared, the price of nickel rose, drawing investment into nickel mining and smelting in Sulawesi.
Consumer surplus, producer surplus and social surplus
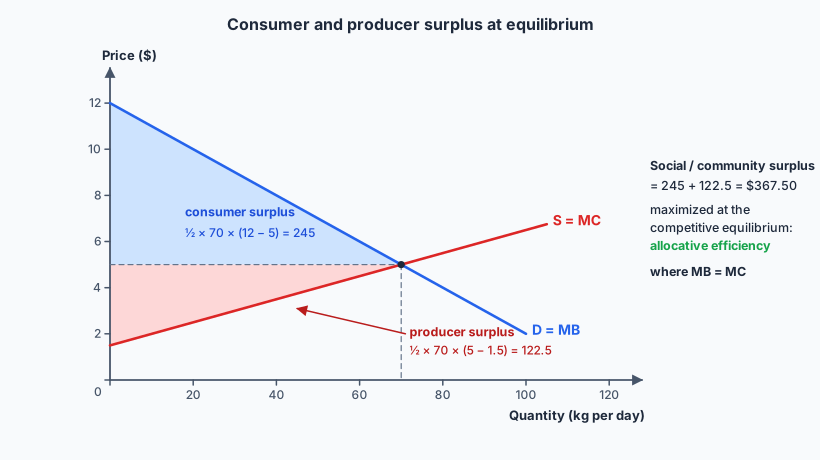
the difference between the highest price consumers are willing to pay and the price they actually pay. The area below the demand curve and above the price.
the difference between the price producers receive and the lowest price they are willing to accept. The area above the supply curve and below the price.
consumer surplus + producer surplus: the total benefit to society from the market.
Allocative efficiency
The demand curve shows the marginal benefit (MB) of each unit to consumers; the supply curve shows the marginal cost (MC) of producing it. Allocative efficiency is achieved when resources produce the combination of goods society values most, which happens where MB = MC.
- For every unit below equilibrium, MB > MC: producing it adds more benefit than it costs, so society gains by producing it.
- For every unit above equilibrium, MB < MC: it costs more than it is worth, so society loses by producing it.
- So output at the competitive equilibrium, where MB = MC, maximizes social surplus. Any other output gives a smaller total: the lost surplus is a welfare (deadweight) loss.
This result depends on the demand and supply curves capturing all benefits and costs. When there are externalities (2.8), market power (2.11) or government-imposed prices (2.7), the market outcome is no longer efficient.
✏️Worked example HL
(a) Calculate consumer surplus, producer surplus and social surplus.
(b) Using the same curves, the quantity demanded at $4 is 80 kg and the quantity supplied 50 kg. Calculate the shortage and explain how the market removes it.
(a) Both surpluses are triangles with base 70 kg.
(b) Shortage = 80 − 50 = 30 kg per day. Buyers who cannot get shallots offer more, and sellers raise prices. As the price rises towards $5, quantity demanded contracts (80 → 70) and quantity supplied extends (50 → 70), until the shortage is gone.
📝Practise
Work through these on paper, then reveal the answer. Tagged questions are modelled on a real IB question from that session, with our own wording, numbers and context.
1. [2 marks, Paper 2 style] Define the term excess supply.
2. [4 marks, Paper 2 style] Using a demand and supply diagram, explain how the price mechanism would respond to a sharp rise in demand for face masks during a disease outbreak.
3. [10 marks, Paper 1 (a) — modelled on May 2024 SL Paper 1 Q1(a)] Using diagrams, explain how cheaper soybean oil and a drought in plantation regions could each change the price of palm oil.
Demand side: choose one determinant and explain the chain. For example, a fall in the price of a substitute (soybean or sunflower oil) makes buyers switch away from palm oil: demand shifts left, creating excess supply at the old price, so the price falls to a new, lower equilibrium with a smaller quantity.
Supply side: for example, higher costs of factors of production (fertilizer and fuel prices, or wage rises on plantations), or an El Niño drought reducing yields: supply shifts left, creating a shortage at the old price, so the price rises and quantity falls.
Two diagrams, each with the shift, the shortage or surplus at the old price and the new equilibrium, plus correct terms (“decrease in demand”, “contraction of supply”), gain the top band.
4. Explain what happens to equilibrium price and quantity if demand for a good increases while supply decreases.
5. HL Demand for a good runs from $20 (at Q = 0) and supply from $4 (at Q = 0). They cross at P = $12, Q = 400 units. Calculate consumer and producer surplus.
6. Explain why producing beyond the competitive equilibrium quantity reduces social surplus.
🔗Go deeper — other people’s work
These are external resources, not mine. If one stops working, tell me and everything above it on this page still stands.
- F. A. Hayek, The Use of Knowledge in Society (1945) — the classic short essay on prices as signals.
- Khan Academy — Consumer surplus, producer surplus and deadweight loss.
- Marginal Revolution University — The price system series.