Exchange rates
🎯What you need to be able to do
- Explain how floating exchange rates are determined, with appreciation and depreciation, and draw the diagram.
- Explain the factors that change demand for and supply of a currency: exports, imports, FDI, portfolio investment, remittances, speculation, relative inflation, interest and growth rates, and central bank intervention.
- Calculate the price of a good in different currencies and changes in the value of a currency.
- Explain the consequences of exchange rate changes for inflation, growth, unemployment, the current account and living standards, with an AD/AS diagram.
- Explain fixed exchange rates (devaluation, revaluation, how they are maintained) and managed exchange rates; over- and undervalued currencies; draw the diagrams.
- HL Evaluate fixed versus floating exchange rate systems.
📚The economics
Floating exchange rates
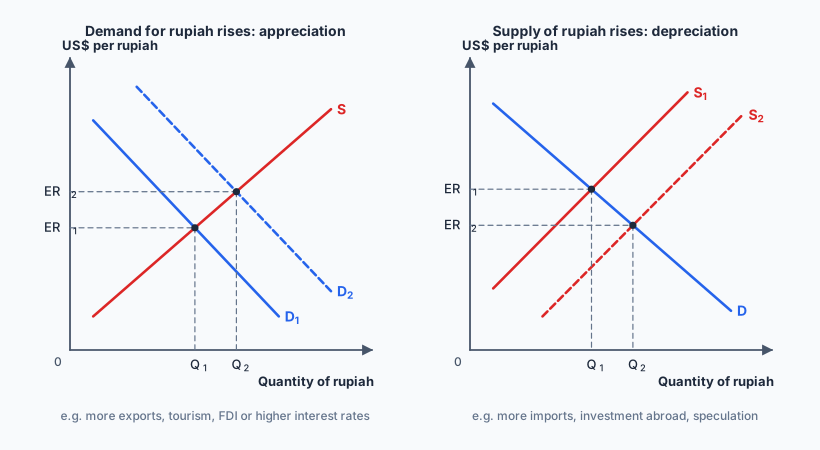
In a floating system, the exchange rate is determined by the demand for and supply of the currency on the foreign exchange market, with no government target.
- Demand for rupiah comes from foreigners who need rupiah: to buy Indonesian exports (coal, palm oil, nickel), to visit Bali, to invest in Indonesian firms and bonds, and to send remittances to Indonesia.
- Supply of rupiah comes from Indonesians exchanging rupiah for foreign currency: to buy imports, travel abroad, invest overseas and send money abroad.
a rise in the value of a currency in a floating system: each rupiah buys more foreign currency.
a fall in the value of a currency in a floating system: each rupiah buys less foreign currency.
What shifts demand and supply
- Foreign demand for exports ↑ ⇒ demand for the currency ↑ ⇒ appreciation (a commodity boom strengthens commodity exporters’ currencies).
- Domestic demand for imports ↑ ⇒ supply of the currency ↑ ⇒ depreciation.
- Inward FDI ↑ (foreign firms building factories) ⇒ demand ↑; outward FDI ↑ ⇒ supply ↑.
- Portfolio investment (buying shares and bonds) flows in ⇒ demand ↑; flows out ⇒ supply ↑. These “hot money” flows can move quickly.
- Remittances into the country (from Indonesian workers abroad) ⇒ demand ↑.
- Speculation: if traders expect the currency to rise they buy it now, raising demand (and vice versa); expectations can become self-fulfilling.
- Relative inflation rates: higher inflation at home makes exports less competitive and imports relatively cheaper: demand ↓, supply ↑, so the currency depreciates.
- Relative interest rates: higher interest rates at home attract financial inflows seeking better returns: demand ↑, appreciation. When the US Federal Reserve raised rates sharply in 2022–23, capital flowed to the US and many emerging-market currencies, including the rupiah, weakened.
- Relative growth rates: faster growth raises import demand (supply ↑) but also attracts investment (demand ↑); the net effect varies.
- Central bank intervention: buying the currency with foreign reserves raises demand; selling it raises supply.
Calculations
- Price in another currency: if US$1 = Rp 16 000, a US$25 book costs 25 × 16 000 = Rp 400 000; a Rp 1 200 000 hotel night costs 1 200 000 ÷ 16 000 = US$75.
- Percentage change in value: if the rate moves from Rp 15 000 to Rp 16 500 per US$, the dollar has appreciated by 1500 ÷ 15 000 = 10%. The rupiah’s value in dollars fell from 1/15 000 to 1/16 500, a depreciation of 9.1%. (Take care which currency you are describing.)
Consequences of exchange rate changes
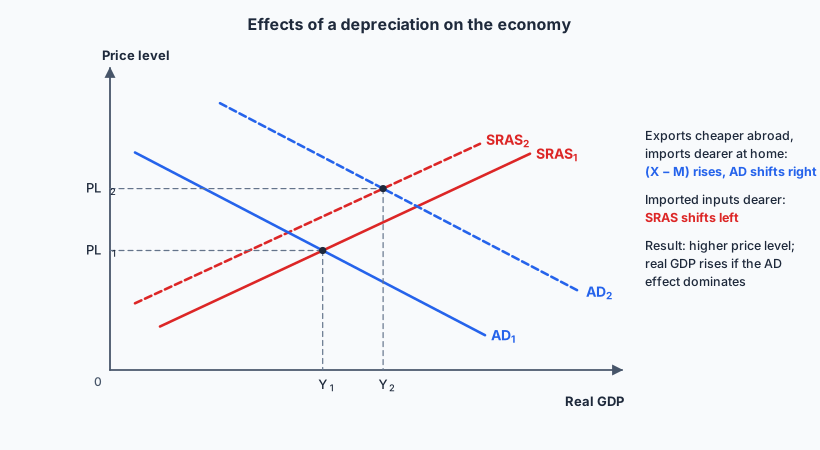
Inflation ↑: imported goods and inputs cost more (cost-push), and higher net exports raise AD (demand-pull).
Growth ↑, unemployment ↓: exports cheaper abroad and imports dearer, so X − M rises (if demand is elastic enough: Marshall–Lerner, 4.6).
Current account: improves over time (J-curve).
Living standards: imported goods and foreign travel cost more; foreign-currency debts cost more to repay.
Inflation ↓: cheaper imports and inputs.
Growth ↓, unemployment ↑: exports lose competitiveness, imports win market share (export and import-competing industries suffer).
Current account: worsens.
Living standards: consumers gain from cheaper imports and travel; foreign debt easier to service.
Fixed exchange rates
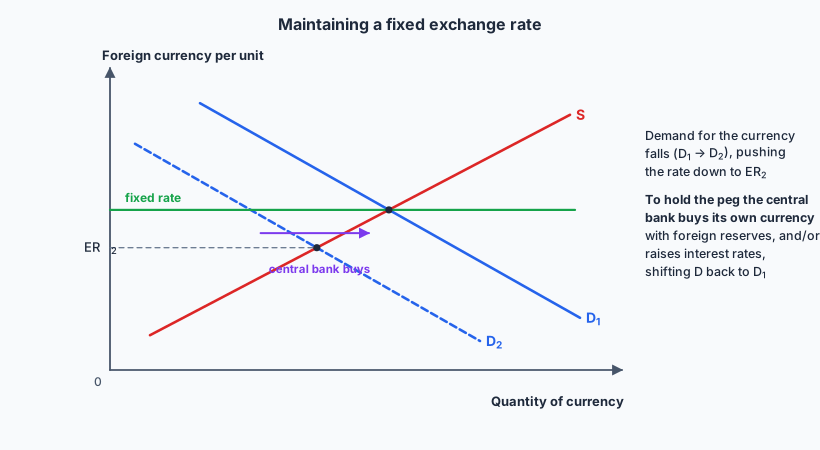
In a fixed (pegged) system, the government or central bank sets the currency’s value against another currency (usually the US dollar) or a basket, and holds it there. Hong Kong has pegged its dollar to the US dollar since 1983; Gulf states such as Saudi Arabia peg to the dollar.
- Devaluation: the government lowers the fixed rate. Revaluation: it raises it.
- How the peg is maintained: if market pressure pushes the currency below the peg, the central bank buys its own currency using foreign exchange reserves (raising demand) and/or raises interest rates to attract inflows; it can also restrict capital outflows or imports. If pressure pushes the currency up, it sells its own currency, building reserves.
Managed exchange rates
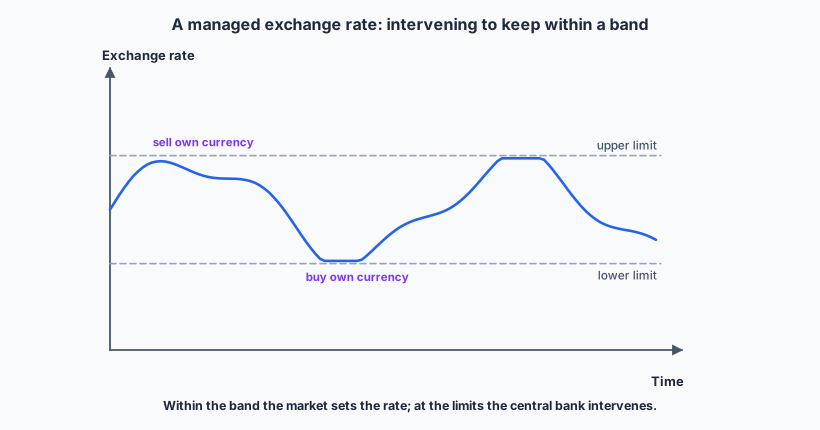
In a managed float, the rate floats but the central bank intervenes, sometimes to keep it within an (unofficial) band and sometimes to smooth sharp movements. Most emerging economies, including Indonesia, operate like this: Bank Indonesia buys rupiah when it falls sharply, using its reserves.
held above its free-market value. Imports are cheap and inflation low, but exports are uncompetitive, the current account worsens, and reserves drain; may end in a forced devaluation.
held below its free-market value. Exports are competitive and reserves build up, but imports are dear, inflation higher, and trading partners accuse the country of unfair competition.
Fixed versus floating exchange rates HL
certainty for traders and investors; discipline on inflation (policy must support the peg); less speculation (if credible). Disadvantages: monetary policy is tied to the peg; large reserves needed; vulnerable to speculative attack if not credible (Thailand, 1997); misalignment builds up; no automatic correction of current account imbalances.
monetary policy is free to target domestic goals; the rate adjusts automatically to correct current account imbalances and absorb shocks; no need for large reserves. Disadvantages: volatility and uncertainty for trade and investment; speculation can overshoot; a depreciation can fuel inflation; less discipline.
✏️Worked example
(a) Calculate the percentage change in the value of the US dollar against the rupiah.
(b) An Australian tourist’s Bali villa costs Rp 5 million a night. Calculate its price in A$.
(c) An Indonesian firm imports a machine priced at US$20 000. Calculate the change in its cost in rupiah between January and June.
(a) (16 170 − 15 400) ÷ 15 400 × 100 = 770 ÷ 15 400 × 100 = 5% appreciation of the dollar (the rupiah has depreciated against it).
(b) 5 000 000 ÷ 10 000 = A$500 per night.
(c) January: 20 000 × 15 400 = Rp 308 million. June: 20 000 × 16 170 = Rp 323.4 million. The machine costs Rp 15.4 million more (5% more): imported capital goods are dearer, a cost-push effect.
📝Practise
Tagged questions are modelled on a real IB question from that session, with our own wording, numbers and context.
1. [2 marks, Paper 2 style] Define the term depreciation.
2. [10 marks, Paper 1 (a) — modelled on November 2023 HL Paper 1 Q3(a)] Explain, with a diagram, how the price of the rupiah in US dollars is set in a floating system and why it changes.
3. [10 marks, Paper 1 (a) — modelled on November 2024 HL Paper 1 Q3(a)] Explain why a country whose inflation is persistently higher than its trading partners’ tends to see its currency depreciate.
4. [15 marks, Paper 1 (b) — modelled on November 2022 SL Paper 1 Q3(b)] Using real-world examples, discuss who gains and who loses when a country’s currency appreciates strongly.
5. [15 marks, Paper 1 (b) — modelled on November 2023 HL Paper 1 Q3(b)] Using real-world examples, examine whether a depreciation is a reliable way to reduce unemployment and a current account deficit.
6. HL Explain why a fixed exchange rate might come under speculative attack.
🔗Go deeper — other people’s work
These are external resources, not mine. If one stops working, tell me and everything above it on this page still stands.
- Bank Indonesia — the JISDOR reference rate for the rupiah against the US dollar.
- IMF — Annual Report on Exchange Arrangements and Exchange Restrictions, which classifies every country’s regime.
- The Economist’s Big Mac index — a light-hearted test of over- and undervaluation.