Home › Learning Hub › IB DP Economics › 2.12 The market and equity
2.12

The market’s inability to achieve equity

Unit 2 · Microeconomics · Higher level only

This topic is higher level only and short, but it is the bridge from Unit 2 to the macro topic on inequality and poverty (3.4). A market can be perfectly efficient and still deliver very unequal outcomes, because it rewards people according to what they own and what they can sell, not according to what they need. The circular flow model shows why.

🎯What you need to be able to do

  • HL Explain why the workings of a free market economy may result in an unequal distribution of income and wealth.
  • HL Use the circular flow model to illustrate why the free market results in inequalities.

📚The economics

Efficiency is not equity

The competitive market allocates resources efficiently: goods go to those willing and able to pay most, and factors to their most profitable uses (2.3). But “willing and able to pay” depends on income. A market responds to purchasing power, not to need: luxury villas get built while low-income families lack housing, because that is where the spending is. Whether the resulting distribution is fair is a normative question of equity (1.2), and the market has no mechanism for answering it.

Why markets generate inequality

  • Unequal ownership of factors of production. In the circular flow, households earn income by selling factor services to firms: rent for land, interest and dividends for capital, profit for enterprise, wages for labour. Households that own land, property and shares receive several income streams; households with only their labour receive wages. Ownership of land and capital is very unevenly spread.
  • Unequal rewards for labour. Wages are set in labour markets by demand and supply. Scarce, high-demand skills (surgeons, software engineers) earn high wages; abundant low-skill labour earns little. Differences in education, health and connections (human capital) therefore become differences in income.
  • Wealth builds on itself. Higher-income households can save and invest, earning interest, dividends and capital gains, which raise their wealth and future income further. Lower-income households spend almost all their income on necessities and accumulate little. Inherited wealth passes the advantage to the next generation.
  • Market power. Owners of firms with monopoly or oligopoly power earn abnormal profits (2.11), shifting income from consumers to shareholders.
  • No income for those outside the market. People who cannot sell factor services — the elderly, the sick, people with disabilities, the unemployed, carers — receive nothing from the market at all.
  • Shocks hit unevenly. Technological change and globalization raise the reward to some skills and cut it for others.
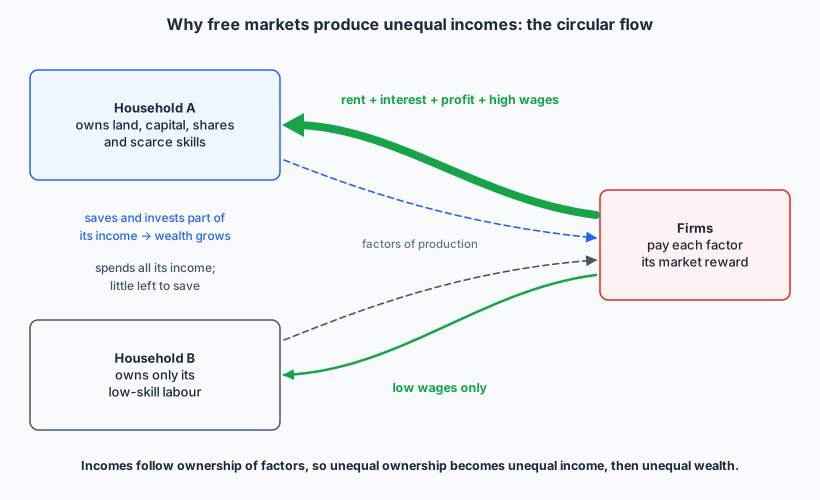
Firms pay factor incomes to households. Household A, which owns land, capital, shares and scarce skills, receives a thick flow of rent, interest, profit and high wages, and saves and invests part of it so its wealth grows. Household B, which owns only low-skill labour, receives a thin flow of low wages and spends all of it, with little left to save.
The circular flow splits unevenly: income follows the ownership of factors.

So, left alone, the free market tends to produce an unequal distribution of income (a flow over time) and an even more unequal distribution of wealth (a stock of assets). How much inequality is acceptable, and what to do about it through taxes, transfers, minimum wages and public services, is the subject of 3.4.

✏️Worked example HL

Two households each start the year with the same wage income of Rp 60 million. Household A also owns a rental villa earning Rp 40 million a year and saves 30% of total income, investing it at 8% a year. Household B owns no assets and saves nothing. Explain, with a calculation for the first year, how the market widens the gap between them.

Household A’s income = 60 + 40 = Rp 100 million; B’s = Rp 60 million. The gap is already Rp 40 million, entirely from ownership of land/property, not effort.

A saves 30% × 100 = Rp 30 million, which earns 8% × 30 = Rp 2.4 million in interest the next year. Next year A’s income is at least Rp 102.4 million while B’s stays at 60. Each year A’s wealth and investment income grow; B’s do not. The market has done nothing “wrong” — every payment is a market reward — yet the gap widens.

Check it. Income is a flow (per year); wealth is a stock (the villa, the savings). Inequality in wealth generates inequality in income, which then adds to wealth.
Saying the market is “unfair” as a positive statement. That inequality results is positive; that it is unfair is normative. Keep the two separate in essays, and use “inequality” for the fact and “inequity” for the judgment.

📝Practise

All HL.

1. Distinguish between income and wealth.
Income is a flow of money received over a period (wages, rent, interest, profit, transfers). Wealth is a stock of assets owned at a point in time (property, land, savings, shares), minus debts. Wealth generates income; saved income adds to wealth.
2. [4 marks, Paper 2 style] Using a circular flow diagram, explain why the free market may lead to an unequal distribution of income.
Diagram: households supply factors of production to firms and receive factor incomes (rent, wages, interest, profit). Explanation: incomes depend on the quantity and value of factors each household owns. Households owning capital and land, or scarce skills, receive large income flows; those with only low-skill labour receive small wage flows; those with no factors to sell receive nothing. As ownership is unequal, the flows are unequal.
3. Explain why a market economy may produce luxury goods while basic needs of some households go unmet.
Firms respond to effective demand (willingness and ability to pay), and profit is higher where spending is concentrated. High-income households have the purchasing power, so resources flow into luxury villas, private clinics and premium goods. Poor households may need housing, healthcare or nutrition, but without the income to pay, their needs send no price signal. The allocation can be efficient given incomes but inequitable.
4. Explain how differences in human capital lead to income inequality in a market economy.
Workers with more education, training and better health are more productive, so firms’ demand for their labour is higher, and scarce skills are in limited supply: their wages are high. Workers with little education supply abundant low-skill labour with lower productivity: wages are low. Because access to education and health often depends on family income, inequality is passed on across generations.
5. Explain why inequality in wealth tends to increase over time in a free market.
Wealthy households earn income from their assets (rent, interest, dividends, capital gains) on top of earnings, and can save a larger share of their income. Their savings are invested and generate further returns (compounding). Poorer households spend most of their income on necessities, save little, and may have to borrow at high interest. Asset prices (property, shares) have often risen faster than wages. Inheritance transmits wealth across generations. So, without intervention, the wealth gap tends to widen.
6. Explain why a market economy can be allocatively efficient and yet inequitable.
Allocative efficiency (MB = MC) is defined for a given distribution of income: demand, and so marginal benefit, reflects willingness and ability to pay. If income is very unequally distributed, the efficient outcome devotes resources to what rich households want and gives little to poor ones. Efficiency says nothing about whether that distribution is fair; equity is a separate, normative criterion. A different distribution of income would produce a different, also efficient, allocation.

🔗Go deeper — other people’s work

These are external resources, not mine. If one stops working, tell me and everything above it on this page still stands.

  • World Inequality Database (wid.world) — income and wealth shares of the top 10% and 1% by country, including Indonesia.
  • CORE Econ, The Economy — chapter 19 on economic inequality.
  • Oxfam — annual inequality reports (read critically: they are campaigning documents).