Measuring economic activity
🎯What you need to be able to do
- Explain the equivalence of the income, output and expenditure approaches with reference to the circular flow model.
- Define and calculate nominal GDP (expenditure approach) and GNI from data.
- Calculate real GDP and real GNI using a price deflator, and real GDP/GNI per capita; explain PPP adjustment.
- Draw and explain the business cycle: short-term fluctuations around a long-term growth trend (potential output).
- Evaluate GDP/GNI as measures of economic well-being over time and between countries, and explain alternatives: OECD Better Life Index, Happiness Index, Happy Planet Index.
📚The economics
National income accounting
National income accounting measures the total economic activity of a country over a period, usually a quarter or a year. The circular flow model (1.1) shows why there are three equivalent ways to do it: every rupiah spent on output is received as income by someone who helped produce it.
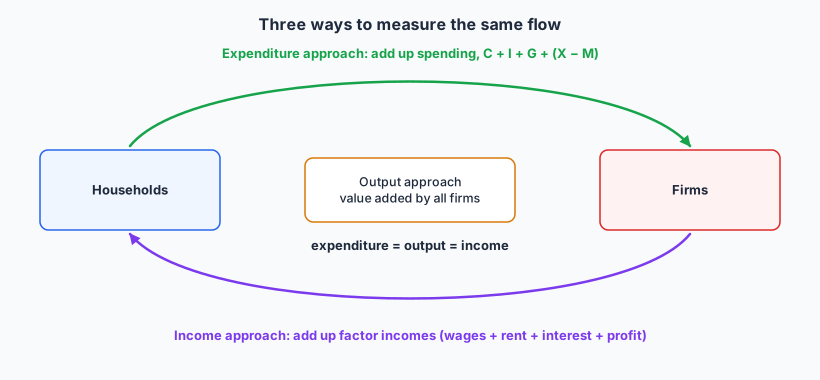
- Expenditure approach: total spending on final goods and services: \( \text{GDP} = C + I + G + (X - M) \).
- Income approach: total factor incomes earned in production: wages, rent, interest and profit.
- Output approach: the value of all final output, or the sum of value added at each stage (counting only final goods avoids double-counting intermediate goods).
In practice the three estimates differ slightly because of statistical errors and the informal economy.
GDP and GNI
the total market value of all final goods and services produced within a country’s borders in a given period, whoever owns the factors of production. A Japanese-owned car factory in West Java counts in Indonesia’s GDP.
the total income earned by a country’s residents and firms, wherever they are located. It equals GDP plus income earned abroad by residents minus income sent abroad by foreign-owned factors.
For countries with a lot of foreign investment (profits flow out), GNI is below GDP; Indonesia’s GNI is a few per cent below its GDP for this reason. Countries whose residents own many assets or work abroad may have GNI above GDP.
Nominal and real values
Nominal GDP is measured at current prices, so it rises when prices rise even if nothing more is produced. Real GDP is adjusted for inflation, measured at the prices of a base year, so it shows changes in the volume of output.
The price deflator is a price index with the base year = 100.
Per capita and purchasing power parity (PPP)
- Real GDP/GNI per capita = real GDP/GNI ÷ population. Total GDP is misleading for comparing living standards: India’s GDP is far larger than Singapore’s, but its GDP per person is much smaller.
- Purchasing power parity (PPP): converting at market exchange rates ignores that prices are lower in poorer countries (a haircut in Denpasar costs far less in US dollars than in Sydney). PPP exchange rates adjust for differences in the cost of living, so values at PPP compare what incomes can actually buy. Real GDP/GNI per capita at PPP is the best single income measure for comparing countries.
The business cycle
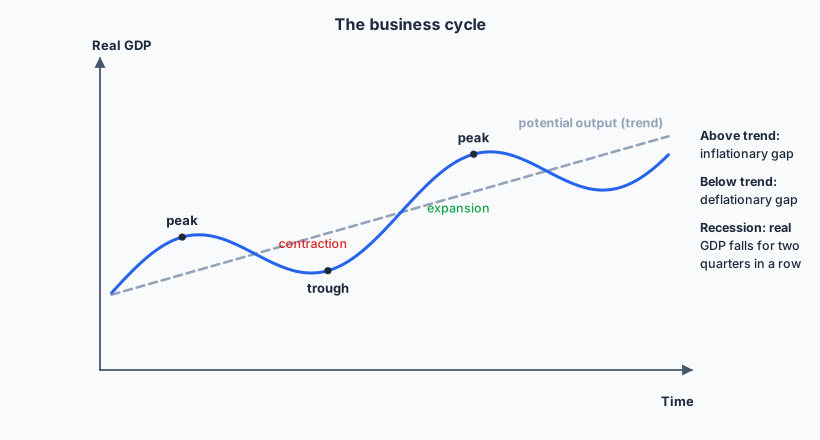
- The long-term growth trend shows potential output: what the economy can produce with full employment of its resources. It rises as the quantity and quality of resources grow.
- Expansion (recovery/boom): real GDP rises; unemployment falls; near the peak, inflation pressures build as actual output exceeds potential (an inflationary gap).
- Peak: the highest point before output starts to fall.
- Contraction: real GDP falls or grows more slowly; unemployment rises. A recession is usually defined as two consecutive quarters of negative real GDP growth. Output below potential is a deflationary (recessionary) gap.
- Trough: the lowest point, before recovery. Indonesia’s only full-year contraction since 1998 came in 2020, during the pandemic.
Is GDP a good measure of well-being?
Using GDP/GNI to compare over time requires real, per capita figures. Even then:
- Distribution: an average hides inequality; GDP per capita can rise while most people’s incomes stagnate.
- Non-market output: unpaid housework, childcare, volunteering and subsistence farming are excluded.
- The informal economy: unrecorded activity (street vendors, cash jobs) is underestimated, and it is large in developing countries.
- Quality of goods improves in ways prices do not capture (a smartphone today versus a phone in 2005).
- Negative externalities and depletion: pollution, deforestation and resource depletion are not subtracted; spending on cleaning up a disaster even adds to GDP.
- Leisure and working hours are ignored.
- Composition of output: spending on weapons and on schools counts the same.
Comparing between countries adds problems: different sizes of informal sector, different accounting practices and data quality, exchange rate distortions (hence PPP), and different needs (heating in cold climates).
Alternative measures of well-being
rates countries on 11 dimensions (housing, income, jobs, community, education, environment, civic engagement, health, life satisfaction, safety, work-life balance). Users can choose their own weights, which makes the value judgment explicit.
based on survey answers about life evaluation, explained by GDP per capita, social support, healthy life expectancy, freedom, generosity and perceptions of corruption. Nordic countries top it.
combines life expectancy and well-being with inequality, divided by the ecological footprint: how efficiently a country turns natural resources into long, happy lives. Some middle-income countries, such as Costa Rica, rank highly while rich high-consumption countries rank poorly.
✏️Worked example
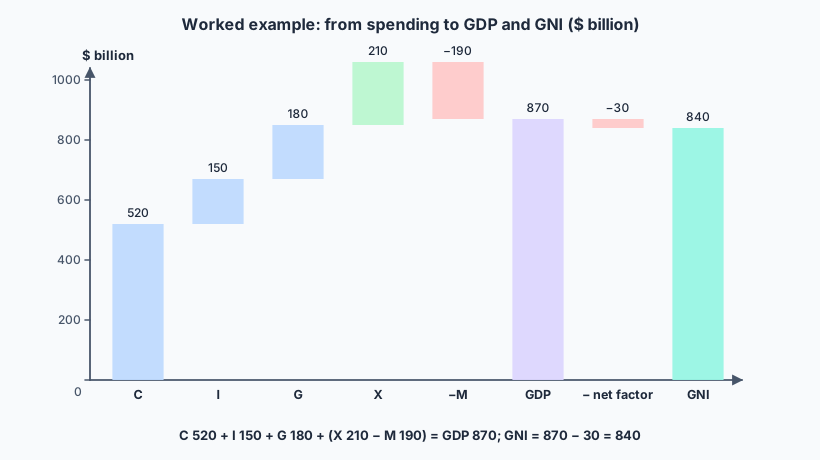
(a) Calculate nominal GDP and nominal GNI.
(b) Calculate real GDP and real GDP per capita.
(c) Next year nominal GDP rises to $935 billion and the deflator to 125. Calculate the real growth rate.
(a)
(b)
(c) Real GDP next year = 935 ÷ 125 × 100 = $748 bn.
Nominal GDP rose by 7.5% (870 to 935), but most of that was inflation; real output grew by about 3.2%.
📝Practise
Tagged questions are modelled on a real IB question from that session, with our own wording, numbers and context.
1. [2 marks, Paper 2 style] Define the term gross national income (GNI).
2. [2 marks, Paper 2 style] Nominal GDP is Rp 20 400 trillion and the GDP deflator is 136. Calculate real GDP.
3. [2 marks, Paper 2 style] Real GDP rose from $412 bn to $431 bn. Calculate the rate of economic growth.
4. Explain why GDP per capita at PPP is a better measure for comparing living standards between countries than total GDP converted at market exchange rates.
5. [15 marks, Paper 1 (b) — modelled on November 2023 HL Paper 1 Q2(b)] Using real-world examples, examine the limitations of comparing living standards across countries using GNI per capita.
Useful: widely available, regular, comparable (especially real and at PPP); strongly correlated with health, education and life expectancy; income enables access to goods and services; GNI captures income actually received by residents (better than GDP where profits flow abroad).
Limitations: distribution (Gini), informal and non-market activity, externalities and depletion (a country clearing forests raises GNI), quality of life, leisure, composition of output, data quality. Examples: oil exporters with high GNI but inequality; countries with modest income but high well-being scores (Costa Rica on the Happy Planet Index).
Judgment: a necessary but insufficient indicator: best used alongside composite measures (HDI, Better Life Index) and distribution data.
6. Explain what is meant by a recession and where it lies on the business cycle.
🔗Go deeper — other people’s work
These are external resources, not mine. If one stops working, tell me and everything above it on this page still stands.
- Badan Pusat Statistik (BPS) — Indonesia’s quarterly GDP releases by expenditure and by sector.
- World Bank Open Data — GDP and GNI per capita, PPP, for every country.
- OECD Better Life Index, World Happiness Report and Happy Planet Index websites — each lets you explore the rankings.