Elasticity of demand
🎯What you need to be able to do
- Explain the concept of elasticity, and define and calculate PED; interpret values from zero to infinity.
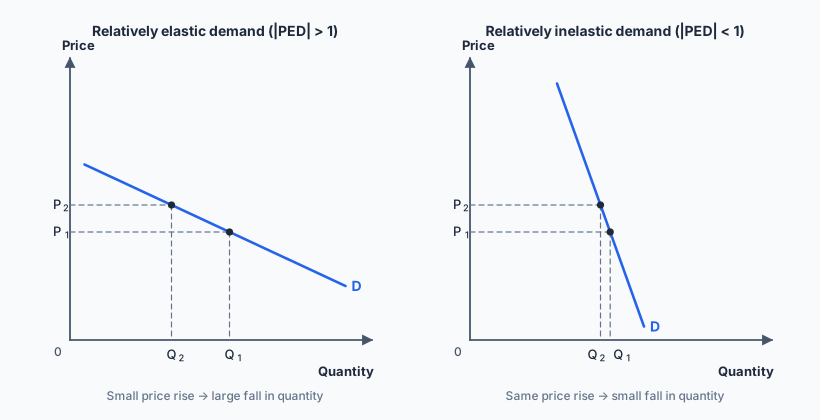
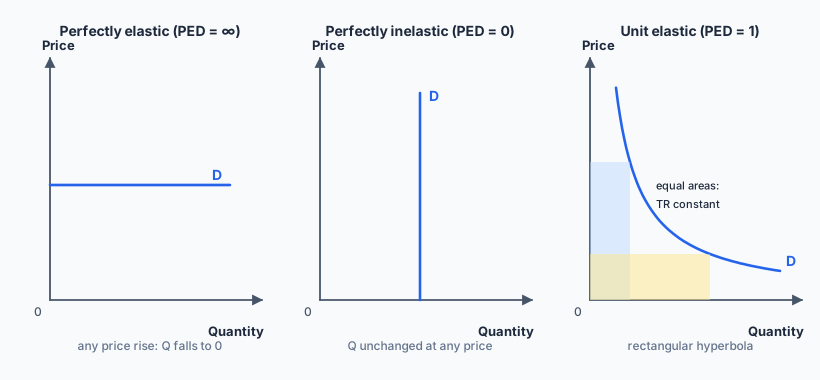
- Draw relatively elastic and inelastic demand, and perfectly elastic, perfectly inelastic and unit elastic demand.
- Explain the determinants of PED: number and closeness of substitutes, degree of necessity, proportion of income spent on the good, and time.
- Explain and calculate the relationship between PED and total revenue, and the importance of PED for firms and governments.
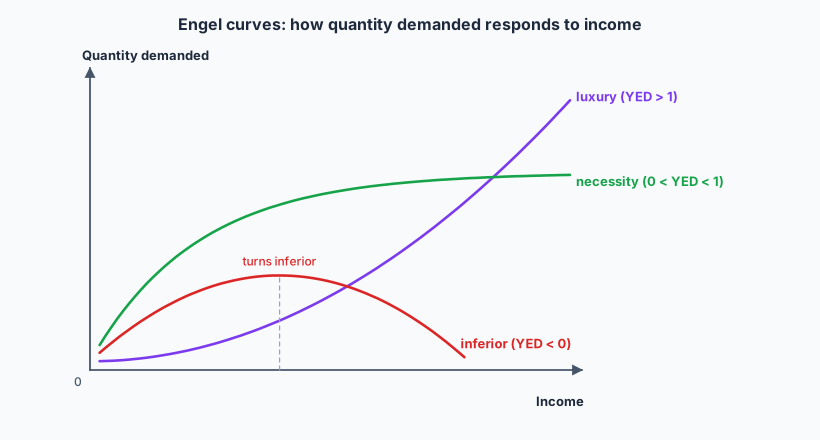
- Define and calculate YED; distinguish normal, inferior, necessity and luxury goods; draw Engel curves.
- HL Explain why PED varies along a straight-line demand curve; explain why primary commodities have lower PED than manufactured goods; explain the importance of YED for firms and for changes in the sectoral structure of the economy.
📚The economics
The concept of elasticity
Elasticity measures the responsiveness of one variable to a change in another, in percentage terms. Percentages are used so that goods measured in different units (litres, cars, haircuts) and different currencies can be compared.
Price elasticity of demand (PED)
PED measures the responsiveness of quantity demanded to a change in the good’s own price.
Because price and quantity demanded move in opposite directions, PED is negative. Economists often drop the sign and compare the absolute value |PED|, but in a calculation answer show the minus sign.
perfectly inelastic: quantity does not respond at all.
relatively inelastic: %ΔQd smaller than %ΔP. Rice, petrol, cigarettes.
unit elastic: %ΔQd equals %ΔP.
relatively elastic: %ΔQd larger than %ΔP. One brand of instant noodles, holiday flights.
perfectly elastic: any price rise cuts quantity to zero.
PED along a straight-line demand curve HL
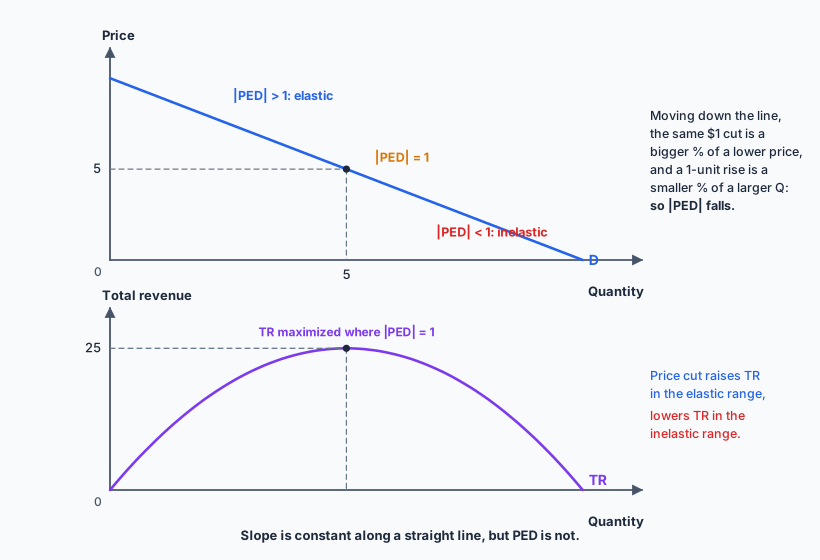
A straight-line demand curve has a constant slope but not a constant PED. At high prices and low quantities, a $1 price change is a small percentage of the price but the resulting change in quantity is a large percentage of the small quantity, so |PED| > 1. Moving down the curve, the reverse happens. So demand is elastic above the midpoint, unit elastic at the midpoint and inelastic below it. Total revenue is maximized at the midpoint.
Determinants of PED
- Number and closeness of substitutes — the most important. The more and closer the substitutes, the more elastic demand is. Demand for one brand of bottled water is very elastic; demand for water as a whole is inelastic. Narrowly defined goods are more elastic than broadly defined ones.
- Degree of necessity: necessities (basic food, medicines, fuel for work) have inelastic demand; luxuries are more elastic. Addictive goods such as cigarettes are highly inelastic.
- Proportion of income spent on the good: a price rise for salt or matches barely affects a budget, so demand is inelastic; for a car or a holiday, it matters, so demand is more elastic.
- Time: demand becomes more elastic over time as consumers find substitutes. When fuel prices rise, people keep driving at first; over months they switch to public transport, car-share or buy more efficient vehicles.
PED and total revenue
Total revenue (TR) = price × quantity. What happens to TR when price changes depends on PED:
Price ↑ ⇒ TR ↑
Price ↓ ⇒ TR ↓
(the % change in quantity is smaller than the % change in price)
Price ↑ ⇒ TR ↓
Price ↓ ⇒ TR ↑
TR unchanged.
Why PED matters for firms and governments
- Firms’ pricing: a firm facing inelastic demand can raise revenue by raising its price; with elastic demand it should consider cutting price. Firms try to make demand less elastic through branding and loyalty schemes.
- Price discrimination: airlines charge business travellers (inelastic) more than tourists booking early (elastic).
- Indirect taxes: governments raise the most revenue from taxing goods with inelastic demand (tobacco, fuel, alcohol), because quantity falls little. But if the aim is to reduce consumption, inelastic demand is a problem: the tax raises revenue without cutting use much. Indonesia raises tobacco excise almost every year, collecting large revenues while smoking rates fall only slowly.
- Tax incidence: the more inelastic the demand, the larger the share of a tax paid by consumers (2.7).
- Subsidies and price controls: the effect on output depends on elasticities.
Why primary commodities have low PED HL
Primary commodities (food, raw materials, fuels) tend to have more inelastic demand than manufactured goods because they are often necessities with few substitutes (there is no substitute for food as a whole, and industry needs specific metals and fuels), and because raw materials are a small part of the final price of the goods made from them. Manufactured goods are more varied, with many brands and substitutes. The consequence: when commodity supply shifts, prices swing sharply, which destabilizes the export earnings of commodity-dependent countries (4.9).
Income elasticity of demand (YED)
YED measures the responsiveness of demand to a change in consumers’ income.
Here the sign matters:
inferior good: demand falls as income rises. Instant noodles, public buses, cheap cigarettes (kretek) in some households.
normal good, income inelastic: necessity. Rice in a middle-income country, electricity, basic clothing.
normal good, income elastic: luxury, and most services: restaurant meals, international travel, private healthcare, streaming subscriptions.
The importance of YED HL
- For firms: in a growing economy, firms selling income-elastic goods see demand rise fastest; in a recession they suffer most. Firms selling inferior goods may do well in recessions (discount stores). Firms use YED to plan capacity and to spread risk across products.
- Sectoral structure of the economy: as incomes rise, spending on primary products (YED low) grows slowly, spending on manufactured goods grows faster, and spending on services (YED high) grows fastest. So the share of output and employment in agriculture falls, then manufacturing, while services expand. Indonesia’s share of employment in agriculture has fallen steadily for decades while services have grown. For commodity exporters, low YED means that world demand for their exports grows more slowly than world income.
✏️Worked example
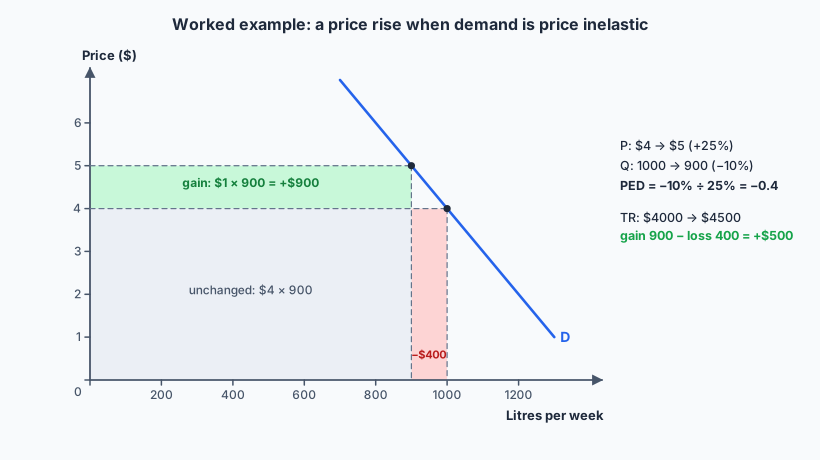
(a) Calculate the PED and comment on the result.
(b) Calculate the change in total revenue.
(c) When household incomes rise by 5%, demand for a bus service falls by 2%. Calculate YED and identify the type of good.
(a) %ΔP = (5 − 4) ÷ 4 × 100 = +25%; %ΔQd = (900 − 1000) ÷ 1000 × 100 = −10%.
|PED| = 0.4 < 1, so demand is price inelastic: few close substitutes in the short run, and fuel is a necessity for many drivers.
(b) TR before = 4 × 1000 = $4000; TR after = 5 × 900 = $4500. TR rises by $500, as expected when demand is inelastic and price rises.
(c)
YED is negative, so the bus service is an inferior good: as incomes rise, people switch to motorcycles, cars or ride-hailing.
📝Practise
Work through these on paper, then reveal the answer. Tagged questions are modelled on a real IB question from that session, with our own wording, numbers and context.
1. [2 marks, Paper 2 style] A café cuts the price of a smoothie from $3.00 to $2.40 and sales rise from 200 to 260 a day. Calculate the PED.
2. [2 marks, Paper 2 style] PED for a product is −0.6. Its price rises by 15%. Calculate the percentage change in quantity demanded.
3. [10 marks, Paper 1 (a) — modelled on November 2023 SL Paper 1 Q1(a)] Explain why one brand of bottled water has more price-elastic demand than electricity, and why salt has less price-elastic demand than a new car.
Define PED with the formula. Substitutes: if a good has many close substitutes, a price rise makes consumers switch easily, so quantity demanded falls by a larger percentage: demand is elastic (one brand of shampoo). Few substitutes (petrol, electricity) means inelastic demand. Proportion of income: when a good takes a small share of income, a price rise barely affects the budget, so consumers hardly react (salt, matches): inelastic. A large share (a motorcycle, rent) makes the income effect strong: elastic.
Use two diagrams (a flatter and a steeper demand curve with the same price change) and explain them in the text.
4. [15 marks, Paper 1 (b) — modelled on November 2023 SL Paper 1 Q1(b)] Using real-world examples, examine how airlines, cinemas and other firms use price elasticity of demand when setting prices, and the limits of doing so.
For: the PED–TR rule: raise prices where demand is inelastic, cut them where elastic, with the revenue diagram. Examples: airlines and hotels price by segment (business versus leisure); cinemas and theme parks discount off-peak; firms with strong brands raise prices.
Limitations: PED is hard to measure and changes over time and along the curve; rivals react (in oligopoly a price cut may be matched, 2.11); revenue is not profit: extra sales raise costs; non-price factors (quality, advertising) also shift demand; ceteris paribus rarely holds.
Judgment: useful as a guide, especially for firms with good data (online retailers testing prices), less so for small firms or in fast-changing markets.
5. [10 marks, Paper 1 (a) — modelled on May 2023 HL Paper 1 Q1(a)] Explain why household spending on restaurant meals, rice and instant noodles responds differently when incomes rise.
6. HL Explain why a government seeking to reduce smoking may be disappointed by a large increase in tobacco tax, even though its tax revenue rises.
🔗Go deeper — other people’s work
These are external resources, not mine. If one stops working, tell me and everything above it on this page still stands.
- Khan Academy — Price elasticity of demand and Total revenue and elasticity.
- World Health Organization — reports on tobacco taxation, with estimates of tobacco price elasticities.
- World Bank Open Data — employment in agriculture, industry and services by country, to see YED reshape an economy.