Elasticity of supply
🎯What you need to be able to do
- Define and calculate PES, and interpret values from zero to infinity.
- Draw relatively elastic and inelastic supply, and perfectly elastic, perfectly inelastic and unit elastic supply.
- Explain the determinants of PES: time, mobility of factors of production, unused capacity, ability to store, and the rate at which costs increase.
- Calculate a change in price or quantity supplied from PES data.
- HL Explain why the PES for primary commodities is generally lower than for manufactured products.
📚The economics
Price elasticity of supply
PES measures the responsiveness of quantity supplied to a change in the price of the good.
Price and quantity supplied move in the same direction, so PES is positive.
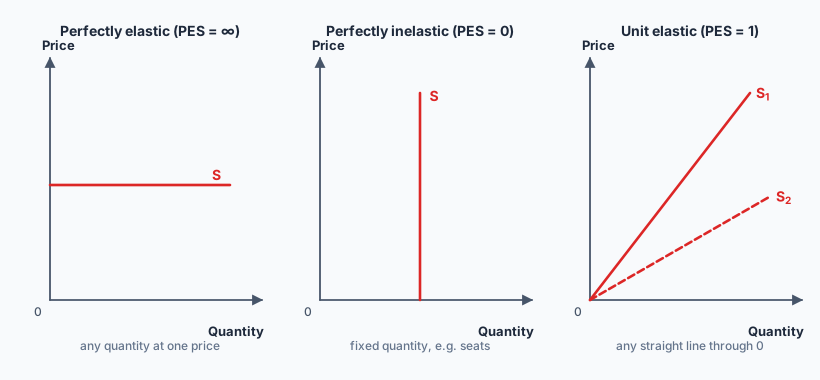
perfectly inelastic: fixed quantity (seats in a stadium on match day, original paintings).
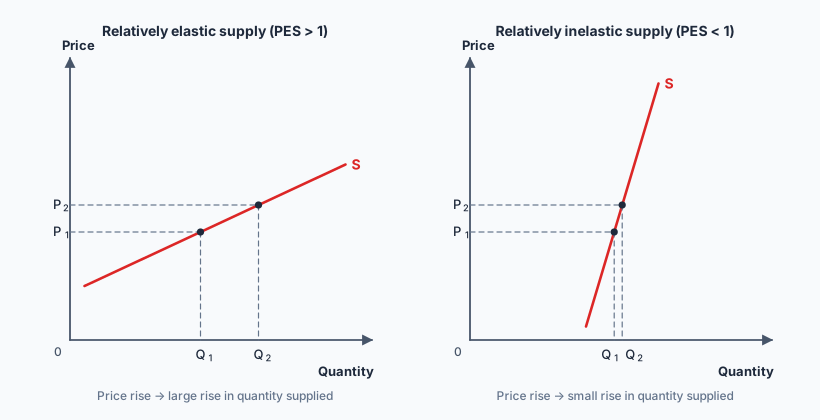
relatively inelastic: %ΔQs < %ΔP. Most farm products in the short run.
unit elastic: any straight-line supply curve through the origin.
relatively elastic: %ΔQs > %ΔP. Many manufactured goods.
perfectly elastic: firms supply any quantity at one price.
Determinants of PES
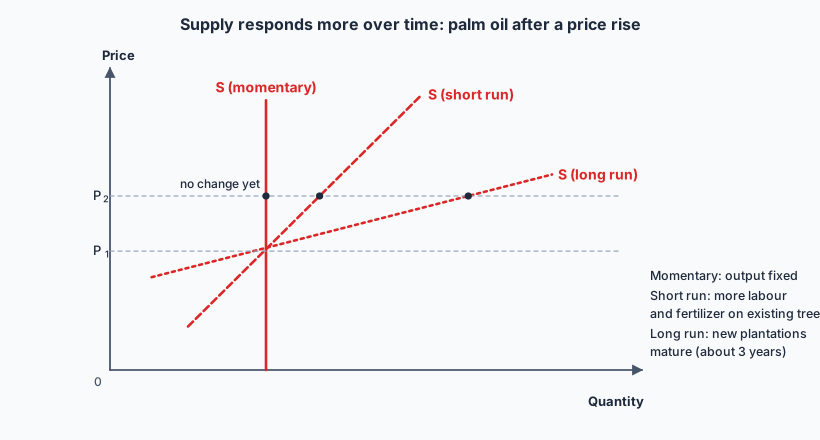
- Time — the most important. Right after a price rise, output may be fixed (momentary period). In the short run, firms can add variable inputs such as labour and overtime. In the long run, they can build new capacity and new firms can enter. Supply becomes more elastic as the time period lengthens.
- Mobility of factors of production: if labour and capital can move easily between uses, supply responds quickly. A garment factory can switch from shirts to face masks; a skilled surgeon cannot be trained in a month.
- Unused (spare) capacity: firms with idle machines and workers can increase output quickly, so supply is elastic. In a recession, spare capacity is common; at full capacity, supply becomes inelastic.
- Ability to store: if goods can be stored cheaply (rice, cement, canned goods), firms can release stocks when prices rise: elastic supply. Perishable goods (fresh fish, flowers, hotel rooms on a given night) cannot be stored: inelastic supply.
- Rate at which costs increase: if producing more raises costs only slightly, supply is elastic; if costs rise quickly with extra output (overtime pay, costlier inputs, diminishing returns), firms need a large price rise to supply more: inelastic.
Why primary commodities have low PES HL
- Long production periods: crops take a season to grow; oil palms take about three years to bear fruit and cocoa longer; new mines take years to open.
- Immobile factors: land suited to one crop or a specific mine cannot be switched quickly.
- Limited storage: many agricultural products are perishable.
- Natural limits: weather and land availability cap output.
Manufactured goods can usually be produced faster, with more mobile factors and spare capacity, so their PES is higher. Combined with the low PED of commodities (2.5), inelastic supply and demand mean that any shift causes large price swings: a poor harvest sends prices soaring, a bumper one makes them crash. This price volatility makes farmers’ incomes and commodity exporters’ export earnings unstable, and is one reason governments intervene with buffer stocks, price floors and diversification.
✏️Worked example
(b) The PES of cement is 2.5. Its price rises by 6%. Calculate the change in quantity supplied.
(c) A furniture maker currently supplies 800 chairs a month. PES = 1.2. Calculate the price rise needed to raise supply to 920 chairs.
(a) %ΔP = 5 ÷ 20 = +25%; %ΔQs = 50 ÷ 400 = +12.5%.
Supply is price inelastic: cocoa trees take years to mature, so in one year farmers can only harvest existing trees more intensively.
(b) %ΔQs = PES × %ΔP = 2.5 × 6% = +15%.
(c) %ΔQs = 120 ÷ 800 = 15%, so %ΔP = 15% ÷ 1.2 = 12.5%.
📝Practise
Work through these on paper, then reveal the answer.
1. [2 marks, Paper 2 style] Define the term price elasticity of supply.
2. [2 marks, Paper 2 style] The price of a smartphone model rises by 8% and quantity supplied rises by 20%. Calculate PES.
3. [4 marks, Paper 2 style] Using a demand and supply diagram, explain why hotel room prices in a tourist resort rise sharply in the peak season.
4. Explain why the supply of fresh fish is more price inelastic than the supply of canned fish.
5. HL Explain why a country dependent on exporting one agricultural commodity experiences unstable export revenues.
6. A firm operating at full capacity faces a sudden increase in demand. Explain how its PES differs in the short run and the long run.
🔗Go deeper — other people’s work
These are external resources, not mine. If one stops working, tell me and everything above it on this page still stands.
- Khan Academy — Price elasticity of supply and its determinants.
- UNCTAD — State of Commodity Dependence reports on commodity-dependent developing countries.
- World Bank Commodity Markets Outlook — the “Pink Sheet” of monthly commodity prices, to see volatility for yourself.