Paper 1: the extended response
🎯What this page covers
- The structure of Paper 1 and what each part assesses.
- How the part (a) and part (b) markbands work, in plain language.
- A timing plan, a paragraph structure and evaluation techniques.
- A full model answer to a part (b) question, and outline answers to part (a) questions.
- Twelve practice questions in the style of recent papers, linked to the notes that answer them.
📚The paper
1 hour 15 minutes, plus 5 minutes’ reading time. No calculator. Answer one question from a choice of three. 25 marks.
SL: 30% of the final grade. HL: 20%. HL questions may include HL-only topics; SL questions do not.
(a) 10 marks: explain (AO2), with a diagram. (b) 15 marks: evaluate, discuss or examine (AO3), “using real-world examples”.
The three questions usually come from different units (one micro, one macro, one global economy), and each part (a) and (b) are linked but test different skills. Read both parts of all three questions before you choose: pick the question where you can do part (b) best, since it carries more marks.
How part (a) is marked (10 marks)
The markband rewards four things, and the top band needs all of them:
- Addressing the specific demands of the question: answer exactly what is asked (if it says “two determinants”, explain two, fully).
- Economic theory fully explained: a chain of cause and effect, not a list of points.
- Terms used appropriately throughout: define the key terms of the question at the start.
- Relevant diagram(s), fully explained: accurate, labelled, and referred to in the text (“as shown by the shift from AD1 to AD2…”).
Roughly: a response that describes relevant theory with some terms sits around 3–4; one that partly explains it with a diagram 5–6; one that explains it with a diagram that is explained 7–8; and one that fully explains everything 9–10. No evaluation is needed in part (a), and real-world examples are optional.
How part (b) is marked (15 marks)
The same four elements, plus two more:
- Synthesis and evaluation: for the top band, “effective and balanced”: arguments on both sides, weighed, leading to a justified conclusion.
- Real-world examples: for the top band, “identified and fully developed to support the argument”. Naming a country is not enough; explain what happened and how it supports your point.
Bands are 1–3, 4–6, 7–9, 10–12 and 13–15. The jump from 7–9 to 10–12 usually comes from balance (both sides) and developed examples; the jump to 13–15 from effective evaluation: judgments that weigh arguments and depend on stated conditions.
Timing plan
read all six parts; choose; start planning part (b) in your head.
3 minutes planning, 22 writing. Roughly one to two pages with a diagram.
5–7 minutes planning (arguments, examples, conclusion), then writing; leave 3 minutes to check diagrams and labels.
A structure that works
- Definitions: define the two or three key terms in the question in one or two sentences.
- Theory with diagram: explain the mechanism step by step, then draw the diagram and refer to it.
- Application: for part (b), a developed real-world example: country, date, policy, what happened, how it links to the theory.
- Evaluation: counter-arguments, limitations, and the conditions under which the view holds.
- Conclusion: a clear, justified judgment that answers the question (“to a large extent, provided that…”).
Evaluation techniques
Examiners look for judgment, not just “on the other hand”. Useful angles:
- Short run versus long run (a depreciation worsens the current account first, then improves it).
- Stakeholders: consumers, producers, workers, government, foreign firms, future generations. Who gains and who loses?
- Size and context: elasticities, how close to full capacity the economy is, the size of the tax or tariff.
- Assumptions: does the theory’s ceteris paribus or rationality assumption hold here?
- Alternatives: is another policy better, or a combination?
- Priorities and values: efficiency versus equity; growth versus sustainability.
- Evidence: what actually happened in your example?
✏️Model answer: part (b)
(Modelled on May 2022 SL Paper 1 Q1(b), which set an evaluation of an indirect tax; the drink context is ours.)
Definitions. An indirect tax is a tax on spending, collected from producers, that raises their costs. A specific tax is a fixed amount per unit (for example per litre or per gram of sugar). Stakeholders are the groups affected: consumers, producers, workers, the government and society.
Theory. Sugar-sweetened beverages (SSBs) are a demerit good with a negative externality of consumption: excess consumption raises obesity and diabetes, imposing costs on public health systems and employers, so marginal social benefit lies below marginal private benefit and the market overconsumes. A specific tax shifts supply up by the amount of the tax. The price to consumers rises from P1 to Pc, the price producers keep falls to Pp, and quantity falls from Q1 to Q2, closer to the social optimum.
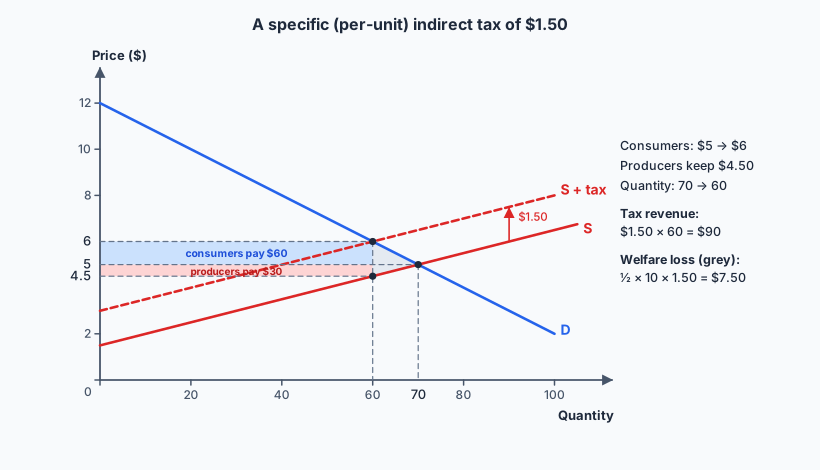
Consumers pay a higher price and buy less; consumer surplus falls. Because demand for sugary drinks is relatively inelastic for habitual buyers, consumers bear most of the tax, and since poorer households spend a larger share of income on such drinks, the tax is regressive. However, consumers who cut back gain health benefits over time.
Producers receive a lower price per unit and sell less, so revenue and producer surplus fall. In practice many producers reformulate to avoid the tax. The UK’s Soft Drinks Industry Levy (2018) was tiered by sugar content, and manufacturers cut the sugar in many drinks before it began, so the sugar sold in soft drinks fell sharply while sales volumes held up better. Workers may lose jobs if output falls, though reformulation limited this in the UK.
The government gains tax revenue (tax × Q2), which can be earmarked (the UK used its levy revenue for school sport and breakfast programmes), making the overall package less regressive. Lower obesity reduces future health spending. Society gains if the tax brings output closer to where MSB = MSC, reducing the welfare loss from overconsumption.
Evaluation. The effects depend on price elasticity of demand: if demand is very inelastic, consumption falls little, so health gains are small while revenue is large and the regressive burden heavy. Consumers may substitute to untaxed sugary products (sweets, sweetened tea or coffee drinks sold by street vendors), especially where the informal sector is large, as in Indonesia, where an SSB excise has been planned and repeatedly postponed. Setting the tax at the right level is hard, because the external cost is difficult to measure. A tax works best combined with education and labelling, which shift demand itself. Over the long run, demand becomes more elastic as habits change, so health effects grow.
Conclusion. An SSB tax is likely to benefit society and the government overall, but it imposes costs on consumers, especially low-income ones, and on producers. Its effectiveness depends above all on the design (a tiered tax that encourages reformulation performed well in the UK), the elasticity of demand and the use of the revenue. Where a large informal sector makes substitution easy, it should be one part of a wider strategy rather than the main tool.
Outline answers to part (a) questions
Part (a) questions ask you to explain. Each outline below shows the chain a top-band answer follows. Full notes are on the linked pages.
- “Explain the effect on aggregate demand of a rise in the central bank’s policy rate.” Define interest rate and AD → cost of borrowing up, reward for saving up → C (credit, mortgages) and I fall → currency may appreciate, X − M falls → AD shifts left: AD/AS diagram showing lower real GDP and price level (3.5).
- “Explain what happens to the profits of price-taking firms after new firms enter their industry.” Definitions → short-run abnormal profit diagram → perfect information and free entry → industry supply shifts right → price falls to minimum AC → two-panel long-run diagram (2.11, HL).
- “Explain two reasons why the rupiah might lose value against the US dollar.” Define depreciation and floating exchange rate → cause 1: higher relative inflation (demand for the currency falls, supply rises) → cause 2: lower relative interest rates (portfolio outflows raise supply) → one exchange rate diagram per cause (4.5).
📝Practice questions in the style of recent papers
Each is modelled on a question from the session named: same topic, skill and marks, but our own wording. The linked page has the theory and, usually, an answer plan. Write the full answer under timed conditions.
1. (a) Compare how a firm in perfect competition and a firm in monopolistic competition decide their price and output. [10] (b) Using real-world examples, evaluate whether consumers benefit when a few very large firms dominate a market. [15] (cf. May 2022 HL Q1)
2. (a) Explain how price controls and subsidies can each be used to intervene in a market. [10] (b) Using real-world examples, discuss whether street lighting and flood defences should be produced by the state or contracted out. [15] (cf. November 2022 SL Q1 and May 2023 SL Q1(b))
3. (a) Explain how a cap-and-trade scheme could help a country meet an emissions target. [10] (b) Using real-world examples, discuss whether subsidizing electric vehicles is the most effective way to cut transport emissions. [15] (cf. November 2023 HL Q1)
4. (a) Explain why demand for petrol is less price elastic than demand for one brand of petrol. [10] (b) Using real-world examples, examine how knowledge of price elasticity of demand can guide a government’s choice of goods to tax. [15] (cf. November 2023 SL Q1)
5. (a) Explain why a recession and the spread of automation cause different types of unemployment. [10] (b) Using real-world examples, evaluate the use of higher government spending to reduce unemployment in a country with a deflationary gap. [15] (cf. May 2024 SL Q2)
6. (a) Using the multiplier, explain how a large public infrastructure programme affects real GDP in the short run. [10] (b) Using real-world examples, examine whether rapid growth inevitably makes other macroeconomic objectives harder to achieve. [15] (cf. May 2024 HL Q2)
7. (a) Explain why a sustained fall in the price level can harm an economy. [10] (b) Using real-world examples, discuss whether governments should give priority to reducing inflation or to reducing unemployment. [15] (cf. May 2023 SL Q2)
8. (a) Explain how spending on transport infrastructure affects both aggregate demand and long-run aggregate supply. [10] (b) Using real-world examples, examine the limitations of supply-side policies. [15] (cf. November 2024 SL Q2)
9. (a) Explain two arguments a developing country might use to justify tariffs on imported steel. [10] (b) Using real-world examples, evaluate the effects on stakeholders of import quotas on food. [15] (cf. November 2023 SL Q3)
10. (a) Explain how higher interest rates and a boom in tourism might each affect a country’s exchange rate. [10] (b) Using real-world examples, discuss whether a strong currency is good for an economy. [15] (cf. November 2022 SL Q3)
11. (a) Explain why relying on a single commodity export may limit a country’s growth. [10] (b) Using real-world examples, evaluate privatization and trade liberalization as strategies for the poorest countries. [15] (cf. May 2023 HL Q3)
12. (a) Explain how development aid could help a country escape a poverty cycle. [10] (b) Using real-world examples, discuss whether low-income countries should offer tax incentives to attract foreign direct investment. [15] (cf. May 2024 HL Q3)
🔗Go deeper — other people’s work
These are external resources, not mine. If one stops working, tell me and everything above it on this page still stands.
- Your school’s IB coordinator — official past papers, markschemes and subject reports (the examiners’ comments on each session are especially useful).
- Economics Online and Tutor2u — articles that model evaluation in essays.
- The Economist and the Financial Times — the best source of developed real-world examples.