Demand
🎯What you need to be able to do
- Define demand and explain the law of demand, drawing a downward-sloping demand curve.
- Explain the relationship between individual consumers’ demand and market demand.
- Explain the non-price determinants of demand: income, tastes and preferences, future price expectations, the price of related goods (substitutes and complements), and the number of consumers.
- Distinguish between movements along the demand curve and shifts of the demand curve, with diagrams.
- HL Explain the assumptions underlying the law of demand: the income and substitution effects and the law of diminishing marginal utility.
📚The economics
Demand and the law of demand
Demand is the quantity of a good or service that consumers are willing and able to buy at each possible price, in a given time period, ceteris paribus. “Able” matters: wanting a new car is not demand unless you can pay for it (effective demand).
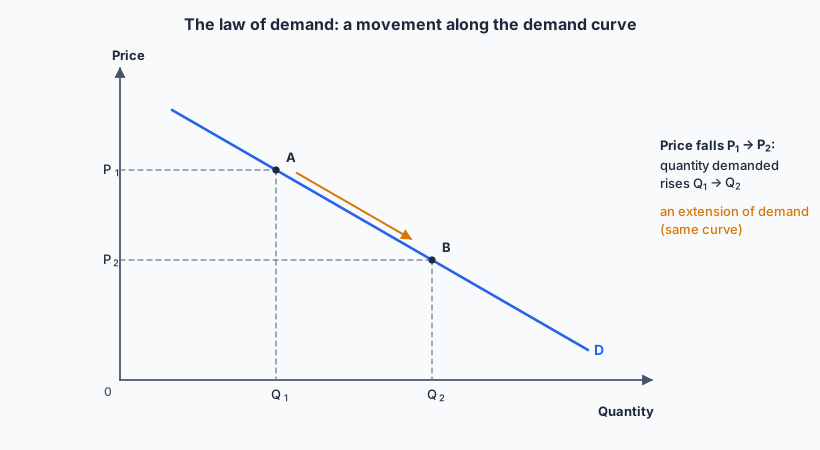
The law of demand states that there is a negative (inverse) relationship between the price of a good and the quantity demanded, ceteris paribus: as price rises, quantity demanded falls; as price falls, quantity demanded rises. Drawn with price on the vertical axis and quantity on the horizontal, the demand curve slopes downwards.
Why the demand curve slopes downwards HL
- The substitution effect. When the price of a good falls, it becomes cheaper relative to other goods, so consumers switch towards it and away from substitutes.
- The income effect. When the price of a good falls, consumers’ real income (purchasing power) rises: the same money buys more. For a normal good, higher real income means buying more of it.
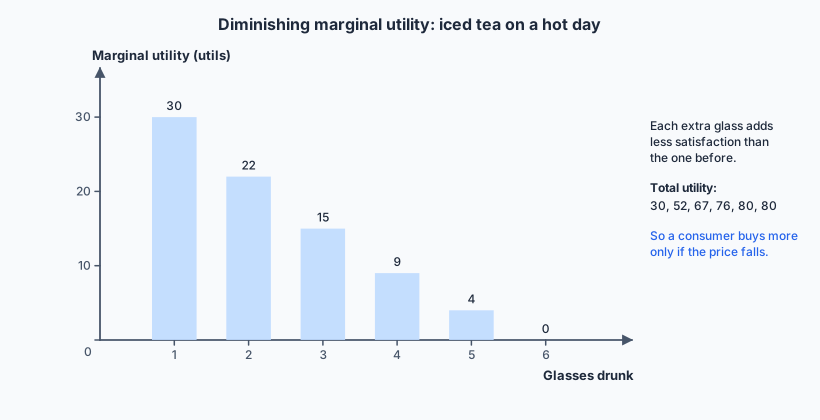
- The law of diminishing marginal utility. Utility is the satisfaction from consuming a good; marginal utility (MU) is the extra satisfaction from one more unit. As consumption of a good increases, the marginal utility of each additional unit falls. Because each extra unit is worth less to the consumer, they will only buy more if the price falls. A demand curve is really a marginal benefit curve.
Individual and market demand
An individual consumer’s demand shows how much one person buys at each price. Market demand is the sum of all individual demands: at each price, add the quantities every consumer demands. On a diagram this is a horizontal summation of the individual demand curves (see the worked example below).
Non-price determinants of demand
A change in any of these shifts the whole demand curve: at every price, more (shift right, an increase in demand) or less (shift left, a decrease) is demanded.
- Income. For a normal good, higher income increases demand (restaurant meals, flights). For an inferior good, higher income decreases demand, as consumers switch to better alternatives (instant noodles, second-hand clothes, bus travel for some households). See YED in 2.5.
- Tastes and preferences. Advertising, fashion, health information and social media change what people want. A health scare about sugar lowers demand for soft drinks; a viral trend raises demand for a snack.
- Future price expectations. If consumers expect prices to rise, they buy now, so demand increases today. Expected price falls lead consumers to wait, so demand falls today.
- Price of related goods. Substitutes are goods used in place of each other (Grab and Gojek rides, tea and coffee): if the price of one rises, demand for the other increases. Complements are goods used together (motorcycles and petrol, printers and ink): if the price of one rises, demand for the other decreases.
- Number of consumers. Population growth, tourism or new export markets add buyers. When international arrivals to Bali recovered after 2022, demand for villa rentals and scooter hire rose.
Movements along and shifts of the demand curve
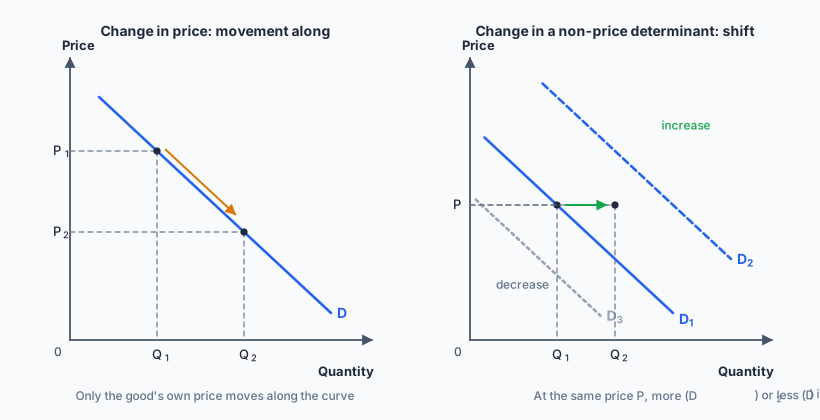
caused only by a change in the good’s own price. A movement along the curve: an extension (price falls) or a contraction (price rises).
caused by a change in a non-price determinant. The whole curve shifts: an increase (right) or a decrease (left) in demand.
✏️Worked example
10, 8, 6, 4
1, 2, 3, 4
0, 1, 3, 5
2, 3, 4, 5
(b) The price rises from Rp 6 thousand to Rp 8 thousand. State the change in quantity demanded and explain whether the demand curve shifts.
(c) A rival kiosk opens next door selling iced tea at a lower price. Explain the likely effect on the market demand for coffee at the kiosk.
(a) Add the three quantities at each price: at Rp 10k, 1 + 0 + 2 = 3; at 8k, 2 + 1 + 3 = 6; at 6k, 3 + 3 + 4 = 10; at 4k, 4 + 5 + 5 = 14 cups per week.
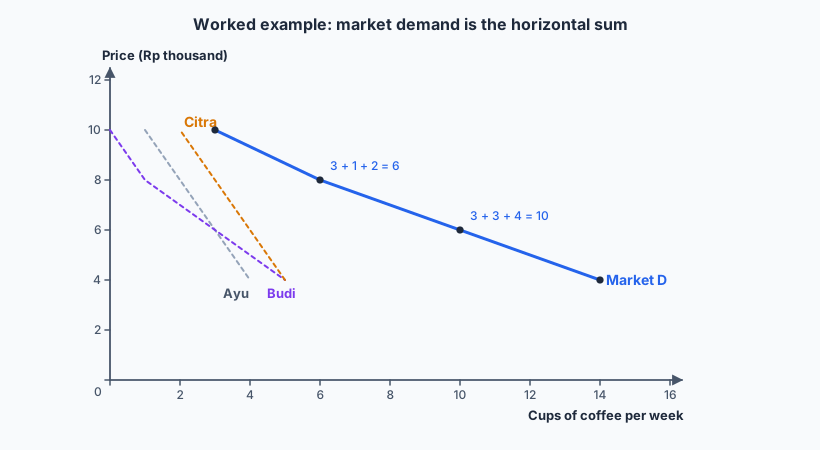
(b) Quantity demanded falls from 10 to 6 cups a week, a fall of 4 cups. The demand curve does not shift: this is a movement along it (a contraction), because only the good’s own price changed.
(c) Cheaper iced tea is a close substitute. Some students switch to it, so at every price fewer cups of coffee are demanded: the market demand curve for the kiosk’s coffee shifts left.
📝Practise
Work through these on paper, then reveal the answer. Questions tagged with a session are modelled on a real IB question from that session: same topic, skill and marks, but our own wording and context.
1. [2 marks, Paper 2 style] Define the term complementary goods.
2. [4 marks, Paper 2 style] Using a demand and supply diagram, explain the effect on the market for rice of a rise in household incomes, if rice is an inferior good for most households.
3. [10 marks, Paper 1 (a) — modelled on May 2024 SL Paper 1 Q1(a)] Explain how a fall in the price of motorcycles might affect the markets for petrol and for public bus travel.
A fall in the price of motorcycles causes an extension of demand for motorcycles (movement along D), so more people own and ride them.
Petrol is a complement: more motorcycles means more petrol used, so demand for petrol increases (shifts right). With an upward-sloping supply curve, the price and quantity of petrol both rise. Bus travel is a substitute: commuters switch from buses to motorcycles, so demand for bus travel decreases (shifts left): fewer passengers and, in a free market, lower fares.
Top-band answers draw two labelled diagrams (one per market), define substitutes and complements, and explain the chain of reasoning rather than just stating the outcome. If bus fares are fixed by the government, note that the fall in demand shows up as fewer passengers rather than a lower price.
4. [10 marks, Paper 1 (a) — modelled on November 2024 SL Paper 1 Q1(a)] Explain, with diagrams, why a surge in tourist arrivals raises both hotel room rates and bookings, while a rise in room rates on its own reduces bookings.
These are two different things. More tourists is a change in a non-price determinant (number of consumers), so the whole demand curve shifts right. At the old price there is a shortage of rooms; hotels raise prices; the new equilibrium has a higher price and more rooms booked.
A rise in the price of rooms, by itself, is a change in the good’s own price, so there is a movement along the existing demand curve: quantity demanded contracts, because of the substitution effect (guests switch to villas, guesthouses or other destinations), the income effect (their budgets buy less) and diminishing marginal utility (an extra night is worth less than the first).
Use two diagrams: a demand shift with the new equilibrium, and a movement along one demand curve.
5. HL Explain how the income and substitution effects together explain the law of demand for a normal good.
6. State whether each of the following shifts demand for electric scooters, moves along it, or neither: (a) the price of electric scooters falls; (b) petrol prices rise; (c) consumers expect scooter prices to fall next year; (d) a new battery technology cuts production costs.
🔗Go deeper — other people’s work
These are external resources, not mine. If one stops working, tell me and everything above it on this page still stands.
- Khan Academy — Demand and the law of demand and Change in demand versus change in quantity demanded.
- Marginal Revolution University — short videos on the demand curve and what shifts it.
- CORE Econ, The Economy — chapter 8 on supply and demand with real price data.