Market failure: externalities and common pool resources
🎯What you need to be able to do
- Explain the socially optimum output, where MSB = MSC, as allocative efficiency with social surplus maximized.
- Draw and explain negative and positive externalities of production and of consumption, with the welfare loss.
- Explain merit and demerit goods.
- Explain common pool resources: rivalrous but non-excludable, the tragedy of the commons, and unsustainable production.
- Explain and draw government responses: indirect (Pigouvian) and carbon taxes, legislation and regulation, education, subsidies and government provision; explain tradable permits, international agreements and collective self-governance.
- Evaluate these policies: measurement problems, effectiveness and consequences for stakeholders; explain the need for international cooperation.
- HL Calculate welfare loss from a diagram.
📚The economics
The socially optimum output
Market failure occurs when the free market fails to allocate resources efficiently, producing more or less than society wants. To see why, split costs and benefits into private and external parts:
borne or enjoyed by the buyer or seller: marginal private cost (MPC, the supply curve) and marginal private benefit (MPB, the demand curve).
borne or enjoyed by third parties not involved in the transaction.
MSC = MPC + marginal external cost; MSB = MPB + marginal external benefit.
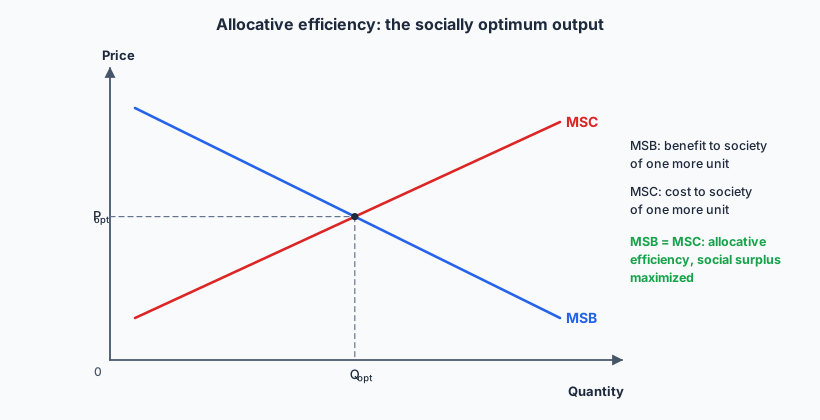
Markets produce where MPB = MPC, because that is what buyers and sellers take into account. Society is best off where MSB = MSC: allocative efficiency, with social surplus maximized. An externality makes these two points different. Every unit between them causes a welfare loss.
Negative externalities of production
Production imposes costs on third parties: air pollution from coal-fired power stations and factories, river pollution from textile dyeing (the Citarum River in West Java is a well-known case), noise, congestion from trucks, greenhouse gas emissions. MSC lies above MPC by the external cost.
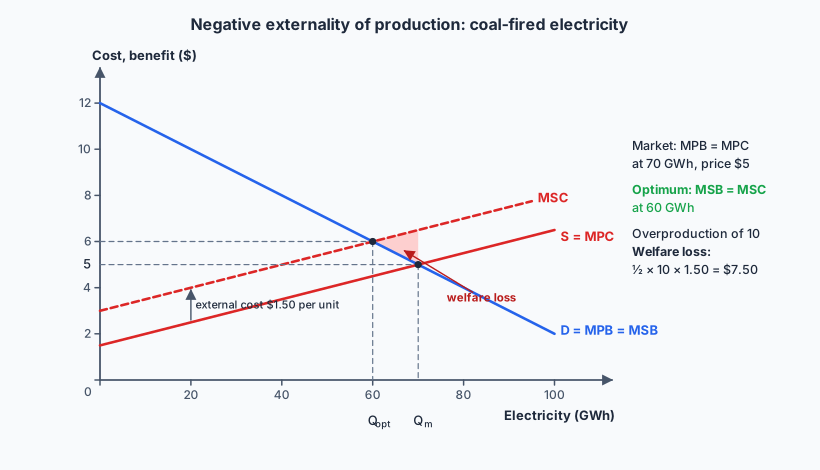
Firms ignore costs they do not pay, so they produce at Qm, where MPB = MPC. At that output, the last units cost society more (MSC) than they are worth (MSB): overproduction and overallocation of resources, at too low a price.
The other three externalities
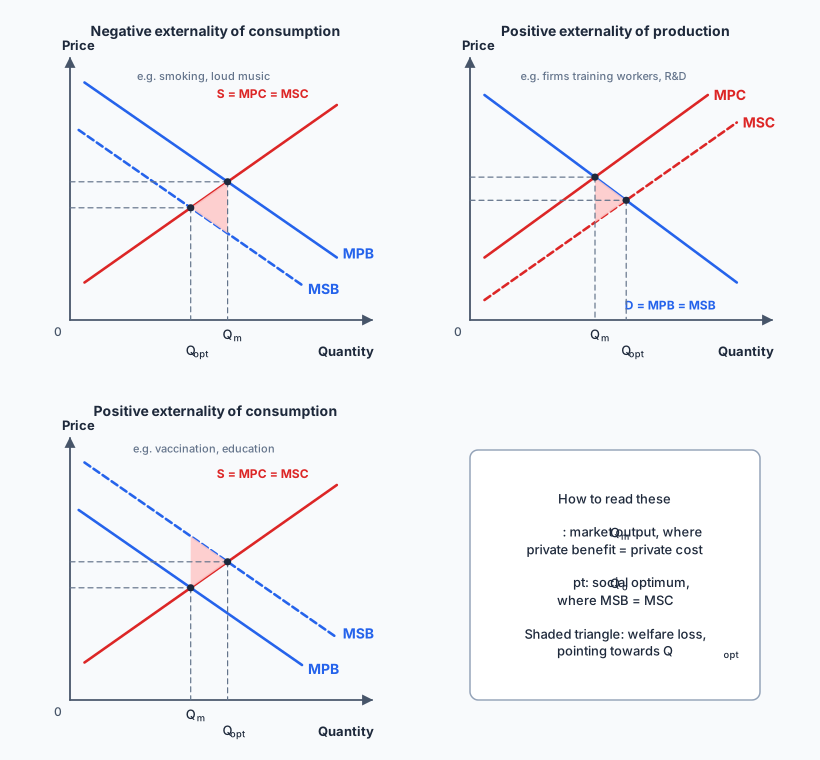
- Negative externality of consumption (MSB < MPB): consumption harms others. Second-hand smoke, drink-driving, loud music, private car use in congested cities, single-use plastics littering beaches. Overconsumption: Qm > Qopt.
- Positive externality of production (MSC < MPC): production benefits others. A firm that trains workers who later move to other firms; research and development whose ideas spread; bee-keepers pollinating neighbouring orchards. Underproduction.
- Positive externality of consumption (MSB > MPB): consumption benefits others. Vaccination (herd immunity), education (a more productive, informed, healthier society), healthcare. Underconsumption.
Merit and demerit goods
goods that are good for people but underconsumed in a free market, because of positive consumption externalities, imperfect information (people underestimate the benefit) and low incomes (equity). Education, healthcare, vaccinations, sports facilities.
goods that are harmful to the consumer and overconsumed, because of negative consumption externalities, imperfect information, addiction and bounded self-control. Cigarettes, alcohol, sugary drinks, gambling.
Both involve a value judgment about what is good for people, which is why they overlap with normative economics (1.2).
Common pool resources and the tragedy of the commons
Common pool (common access) resources are rivalrous (one person’s use reduces what is left for others) but non-excludable (it is hard to stop people using them): fish stocks in open seas, groundwater, forests, grazing land, coral reefs, and the atmosphere’s capacity to absorb carbon.
The tragedy of the commons: each user gains the full benefit of taking more, while the cost of depletion is shared by everyone. So each has an incentive to over-use, and the resource is depleted, even though all users would be better off with restraint. The collapse of the Grand Banks cod fishery off Canada in the early 1990s, overfishing in the Java Sea, and groundwater over-extraction causing land subsidence in Jakarta are examples.
- Unsustainable production creating negative externalities: using a common pool resource faster than it regenerates harms future generations and other users. Burning fossil fuels treats the atmosphere as a free dump; land clearing for plantations degrades forests, biodiversity and water systems.
- This links scarcity to sustainability: no market price signals that the resource is running out, because nobody owns it.
Government responses
1. Indirect (Pigouvian) and carbon taxes
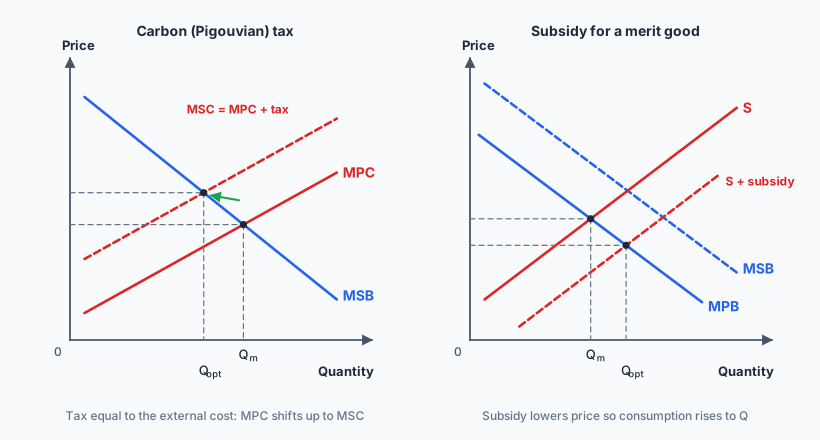
A Pigouvian tax is a tax equal to the marginal external cost, which makes producers or consumers pay the full social cost: it internalizes the externality. In the diagram it shifts MPC up to MSC, cutting output to Qopt. A carbon tax is a Pigouvian tax per tonne of CO2 emitted (Sweden has taxed carbon since 1991; Indonesia legislated a carbon tax in 2021 but has repeatedly postponed it).
Internalizes the externality; uses the price mechanism, so the cheapest pollution cuts happen first; ongoing incentive to adopt cleaner technology; raises revenue that can fund clean energy or compensate poor households.
Hard to measure the external cost in money; if demand is inelastic, pollution falls little; regressive (energy is a large share of poor budgets); firms may relocate to countries without the tax (“carbon leakage”); political opposition.
2. Legislation and regulation
Command-and-control rules: emission limits, bans (Bali’s ban on single-use plastic bags, straws and polystyrene), compulsory catalytic converters, fishing quotas and closed seasons, smoking bans in public places, age limits.
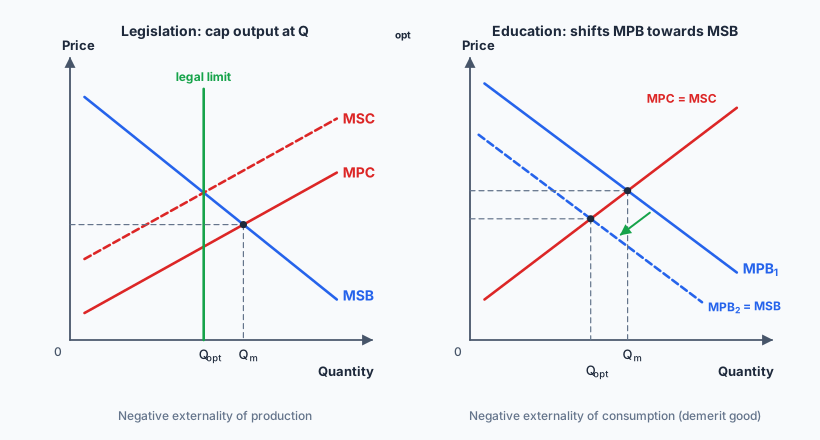
Simple and clear; certain effect on quantity if enforced; best for very harmful activities where a ban is right (toxic waste).
Costly monitoring and enforcement; corruption risk; no incentive to cut pollution below the limit; the same standard for all firms ignores that some can cut more cheaply; setting the right limit requires information the government may lack.
3. Education and awareness
Campaigns, labelling and graphic warnings give consumers better information about harm, shifting MPB left towards MSB for demerit goods (anti-smoking campaigns) and right for merit goods (vaccination drives). Cheap and non-coercive, but slow, uncertain and weak against addiction.
4. Subsidies and government provision
For positive externalities, subsidies lower price and raise consumption or production towards the optimum: subsidized vaccinations, school fees, solar panels, electric vehicles, R&D tax credits. Direct provision by the state, free at the point of use, ensures access: public schools and hospitals, Indonesia’s national health insurance (JKN). Limitations: opportunity cost and budget pressure; difficulty measuring the external benefit; may benefit those who would have consumed anyway.
5. Tradable permits (cap and trade)
The government sets a cap on total pollution and issues permits for that amount. Firms must hold a permit for each tonne they emit and can buy and sell them. Firms that can cut emissions cheaply do so and sell spare permits; firms with high abatement costs buy them. The EU Emissions Trading System (since 2005) is the largest example.
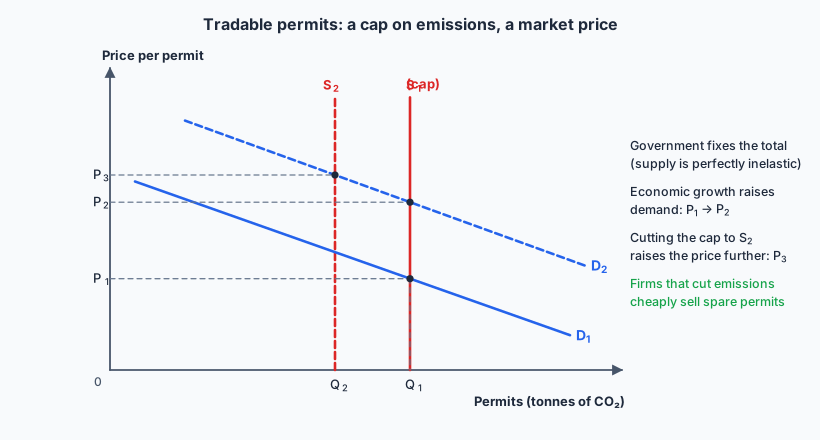
Certain quantity of pollution; cuts made where they are cheapest (cost-efficient); incentive to innovate to sell permits; the cap can be tightened over time; if permits are auctioned, governments earn revenue.
Hard to set the right cap; if too many permits are issued the price collapses (it did in the EU ETS’s early years); price volatility makes planning hard; monitoring emissions is costly; permits given away free reward past polluters; firms may relocate.
6. International agreements and collective self-governance
- International agreements: many externalities cross borders (climate change, ocean plastics, haze from forest fires, overfishing of migratory species), so no single government can solve them. The Montreal Protocol (1987) on ozone-depleting chemicals was a success; the Paris Agreement (2015) sets national climate targets.
- Collective self-governance: Elinor Ostrom (Nobel prize 2009) showed that communities can manage common pool resources sustainably without either privatization or state control, through their own rules, monitoring and sanctions. Bali’s subak system, in which farmers cooperatively allocate irrigation water through water temples, has managed a shared resource for about a thousand years. Village-managed fishing zones (such as sasi in Maluku) are another example. It works best in small, stable communities with clear boundaries and trust.
Why international cooperation is hard
- Global nature of sustainability issues: emissions anywhere affect everyone, so each country is tempted to free ride on others’ cuts.
- Challenges: developed countries caused most historic emissions, while developing countries want to grow (equity); costs are concentrated now, benefits spread and delayed; national sovereignty.
- Monitoring and enforcement: there is no global government to punish countries that miss targets; agreements depend on goodwill, peer pressure and trade links.
✏️Worked example HL
(a) Calculate the welfare loss.
(b) State the tax that would achieve the social optimum, and calculate the revenue it raises.
(a) The welfare loss is the triangle between MSC and MSB from 60 to 70 GWh. At 70 GWh, MSC = 5 + 1.50 = $6.50 and MSB = $5, so the height at the market output is $1.50; at 60 GWh the height is zero.
(b) A Pigouvian tax equal to the marginal external cost, $1.50 per GWh, shifts MPC up to MSC. Output falls to 60 GWh; revenue = 1.50 × 60 = $90. (This is the same diagram as the specific tax on 2.7: with an externality, the “welfare loss” from the tax there becomes a welfare gain here.)
📝Practise
Tagged questions are modelled on a real IB question from that session, with our own wording and context.
1. [2 marks, Paper 2 style] Define the term common pool resource.
2. [10 marks, Paper 1 (a) — modelled on November 2024 HL Paper 1 Q1(a)] Explain why a palm oil plantation company does not take the haze from land-clearing fires into account when deciding how much to produce.
Firms maximize profit using private costs and benefits. The haze harms third parties (respiratory illness, closed schools and airports, lost tourism across the region) who are not part of the transaction and are not compensated. The company does not pay these external costs, so they do not appear in its MPC. It produces where MPB = MPC, at Qm, above Qopt where MSB = MSC.
Diagram: negative production externality, MSC above MPC, Qm > Qopt, welfare loss shaded. Explain overallocation and why the price is too low. Mention the property-rights angle: nobody owns clean air, so nobody can charge for its use.
3. [10 marks, Paper 1 (a) — modelled on November 2022 HL Paper 1 Q1(a)] Explain why the positive externalities of vaccination lead to allocative inefficiency and a welfare loss.
4. [15 marks, Paper 1 (b) — modelled on November 2023 HL Paper 1 Q1(b)] Using real-world examples, evaluate the use of subsidies to speed up the adoption of solar power and electric vehicles.
Subsidy: diagram (positive production externality or supply shift in the market for solar panels / electric motorcycles); lowers price, raises adoption; examples (Indonesia’s incentives for electric motorcycles and cars; Germany’s feed-in tariffs; China’s solar subsidies drove costs down). Limitations: opportunity cost, may go to buyers who would have bought anyway (often richer households), hard to remove, possible trade disputes.
Alternatives: a carbon tax makes dirty energy dearer (internalizes the negative externality directly, raises revenue); tradable permits; regulation (renewable portfolio standards); R&D funding; removing fossil-fuel subsidies.
Judgment: subsidies are politically easier and help infant technologies, but combining them with carbon pricing is usually more effective and cheaper for the budget. Context: a country with fuel subsidies and coal dependence faces different constraints from one with an established carbon price.
5. [15 marks, Paper 1 (b) — modelled on November 2024 HL Paper 1 Q1(b)] Using real-world examples, compare carbon taxes with cap-and-trade schemes as ways of cutting emissions.
Explain cap and trade with the permit diagram. Strengths: certainty of the emissions total, cost-efficiency, innovation incentive, revenue from auctions (EU ETS). Weaknesses: setting the cap, over-allocation and price collapse (early EU ETS), volatility, monitoring, political lobbying for free permits, carbon leakage.
Compare with carbon taxes (price certainty but quantity uncertain; simpler to administer; Sweden), regulation, subsidies for renewables, and international agreements.
Judgment: permits suit large, measurable emitters in countries with strong monitoring institutions; for developing countries with weaker institutions, a simple tax or regulation may work better. No single policy is “best”; most successful cases combine several.
6. [4 marks, Paper 2 style] Explain, with an example, how collective self-governance can prevent the tragedy of the commons.
🔗Go deeper — other people’s work
These are external resources, not mine. If one stops working, tell me and everything above it on this page still stands.
- Elinor Ostrom, Governing the Commons (1990), and her Nobel lecture on the Nobel Prize website.
- World Bank State and Trends of Carbon Pricing — annual survey of carbon taxes and trading schemes.
- J. Stephen Lansing’s research on the Balinese subak system and water temples.