Economics of inequality and poverty
🎯What you need to be able to do
- Explain the relationship between equality and equity; distinguish inequality of income and of wealth.
- Draw a Lorenz curve and explain the Gini coefficient, showing changes in distribution.
- Distinguish absolute and relative poverty; explain single indicators (international poverty lines, minimum income standards) and composite indicators (the MPI); explain the difficulties of measuring poverty.
- Explain causes of inequality and poverty, and the impact of inequality on growth, living standards and social stability.
- Explain progressive, regressive and proportional taxes, average and marginal tax rates, direct and indirect taxes; evaluate taxation and other policies to reduce poverty and inequality.
- HL Construct a Lorenz curve from quintile data; calculate indirect tax paid from expenditure, and total tax and average tax rates from data.
📚The economics
Equality, equity and economic inequality
Equality means everyone has the same; equity means fairness, a normative idea (1.2). Most people accept some inequality as fair (rewarding effort and skill), but see extreme inequality, or inequality of opportunity, as inequitable.
unequal distribution of the flow of income (wages, profits, rent, transfers) across households.
unequal distribution of the stock of assets (property, land, shares, savings). Wealth is usually far more unequal than income, and it passes across generations.
Measuring inequality: the Lorenz curve and Gini coefficient
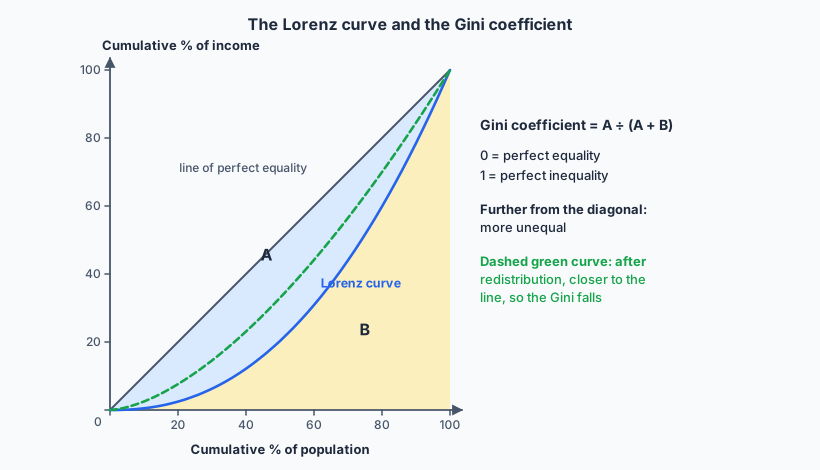
- The Lorenz curve plots the cumulative percentage of income received against the cumulative percentage of households, ranked from poorest to richest.
- The 45° diagonal is the line of perfect equality (the poorest 20% get 20% of income, and so on).
- The Gini coefficient = A ÷ (A + B), from 0 (perfect equality) to 1 (one household has everything); sometimes shown as an index from 0 to 100. Nordic countries are around 0.25–0.28; Indonesia’s consumption-based Gini has been around 0.38 in recent years; South Africa’s is above 0.6.
- A move of the curve towards the diagonal (e.g. after taxes and transfers) shows reduced inequality.
Limitations: the same Gini can hide different shapes (inequality among the poor or among the rich); it says nothing about absolute living standards; data are often based on surveys that miss the very rich; and income and consumption Ginis differ.
Poverty
income below the level needed to meet basic needs: food, clean water, shelter, clothing, basic healthcare. Measured against a fixed line.
income well below the typical level in a society, so people cannot take part in normal life. Often defined as below 50% or 60% of median income. It rises with inequality, even if everyone becomes richer.
Measuring poverty — single indicators:
- International poverty lines: the World Bank’s extreme poverty line (updated in 2025 to $3.00 a day at 2021 PPP) plus higher lines for middle-income countries. Countries also set national poverty lines (Indonesia’s BPS line is based on the cost of a minimum food and non-food basket).
- Minimum income standards: the income needed for a socially acceptable standard of living, based on what members of the public say is needed.
Composite indicators: the Multidimensional Poverty Index (MPI), from the UNDP and Oxford (OPHI), measures deprivation in health (nutrition, child mortality), education (years of schooling, school attendance) and living standards (cooking fuel, sanitation, drinking water, electricity, housing, assets). A person deprived in a third or more of the weighted indicators is multidimensionally poor. It shows how people are poor, not just how little money they have.
Difficulties of measuring poverty: choosing the line is a value judgment; one line cannot reflect different costs of living across regions (Jakarta versus rural Nusa Tenggara); income is hard to measure in informal and subsistence economies (consumption surveys are used instead); household surveys miss homeless people and may not show inequality within households (between men and women); a single money line ignores access to services; and small changes in the line move millions of people in or out of “poverty”.
Causes of inequality and poverty
- Inequality of opportunity: unequal access to good schools, healthcare, finance and networks, often determined by birth, place and parents’ income.
- Different levels of resource ownership: land, property and capital are unequally owned (2.12).
- Different levels of human capital: education, skills and health drive earnings.
- Discrimination by gender, race, ethnicity, religion, caste or disability lowers pay and opportunities.
- Unequal status and power: weak bargaining power of informal workers; political influence of the wealthy.
- Government tax and benefits policies: regressive taxes, weak social protection, subsidies that favour the better-off (fuel subsidies).
- Globalization and technological change: reward skilled workers and capital owners; automation and import competition hit some low-skilled jobs.
- Market-based supply-side policies: cuts to top tax rates, weaker unions and lower benefits may widen inequality (3.7).
Why inequality matters
- Economic growth: high inequality can reduce growth: the poor cannot invest in education or businesses, so talent is wasted; demand is weaker because the rich save more of their income; instability deters investment. Some inequality provides incentives, but beyond a point the IMF and others find it harms sustained growth.
- Standards of living: poorer health, lower life expectancy and weaker education for low-income groups; relative deprivation.
- Social stability: crime, protest, political polarization and loss of trust in institutions.
Taxation to reduce inequality
the average tax rate rises as income rises: higher earners pay a larger percentage. Personal income tax with rising bands.
the same percentage at every income level (a flat tax).
the average tax rate falls as income rises: lower earners pay a larger percentage of their income. Most indirect taxes, such as VAT and excise, because poorer households spend a larger share of income.
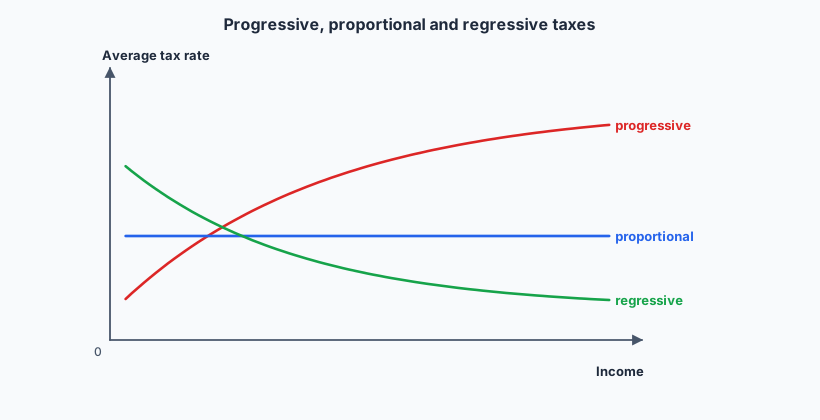
- Average tax rate = total tax paid ÷ total income × 100. Marginal tax rate = the rate paid on the next unit of income (the rate of the highest band reached).
- Direct taxes are paid directly to the government by the person or firm taxed: personal income tax, corporate income tax (on profits), and wealth taxes (on property, inheritance, capital gains).
- Indirect taxes are taxes on spending (VAT, excise duties), collected via sellers.
Evaluation of taxation: progressive income and wealth taxes redistribute and fund public services, but very high rates may reduce incentives to work and invest, encourage avoidance, evasion and capital flight, and are hard to collect where most work is informal (only a minority of Indonesian workers pay income tax). Indirect taxes are easy to collect but regressive, unless basic foods are exempt (Indonesia exempts staples such as rice from VAT).
Other policies to reduce poverty and inequality
- Reducing inequality of opportunity / investing in human capital: free and better schooling, scholarships, early-childhood programmes, universal health coverage (Indonesia’s JKN, with premiums paid for poor members). Powerful but slow.
- Transfer payments: payments with no output in return: pensions, unemployment and disability benefits, child benefits, and conditional cash transfers paid if children attend school and health check-ups (Indonesia’s PKH, Brazil’s Bolsa Família). Can create dependency or disincentives if poorly designed; targeting errors.
- Targeted spending on goods and services: subsidized food (rice for poor households), free school meals, social housing.
- Universal basic income (UBI): an unconditional regular payment to every citizen. Simple, no stigma, a safety net in an age of automation; but very expensive, may reduce work incentives, and benefits the rich too unless taxed back. Trialled in Finland and Kenya.
- Policies to reduce discrimination: anti-discrimination laws, equal pay rules, quotas, affirmative action.
- Minimum wages: raise the pay of the lowest-paid workers, but may cause unemployment if set well above equilibrium (3.3), and do not help informal workers.
✏️Worked example HL
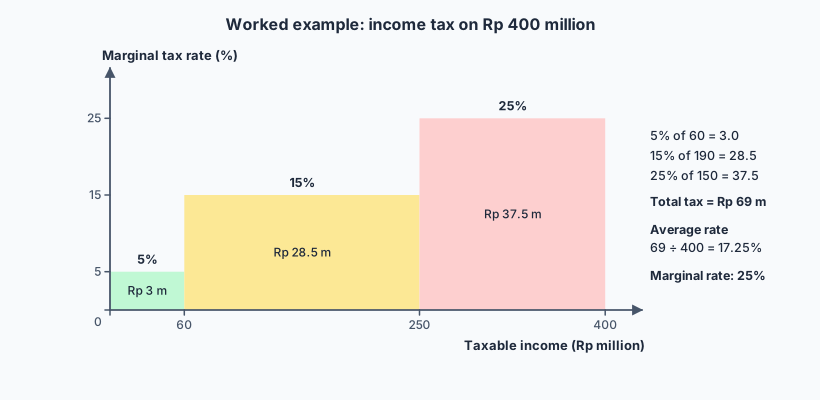
(b) Personal income tax is 5% on the first Rp 60 million of taxable income, 15% on the next Rp 190 million (up to 250 million) and 25% from 250 to 500 million. Calculate the tax paid, the average tax rate and the marginal tax rate on taxable income of Rp 400 million.
(c) A household spends Rp 5.55 million on goods including VAT at 11%. Calculate the VAT paid.
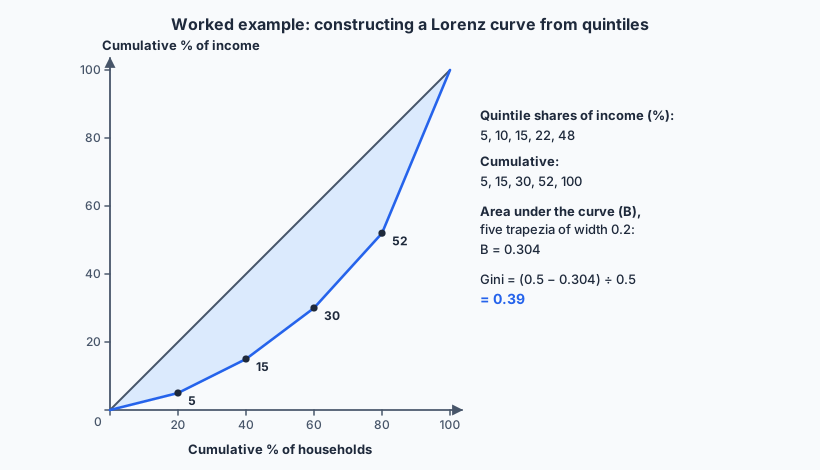
(a) Cumulative shares: 5, 15, 30, 52, 100. Plot these at 20, 40, 60, 80 and 100% of households, starting from (0, 0). The area under the curve is five trapezia, each 0.2 wide:
(b) 5% × 60 = 3.0; 15% × 190 = 28.5; 25% × 150 = 37.5. Total tax = Rp 69 million. Average tax rate = 69 ÷ 400 × 100 = 17.25%. Marginal tax rate = 25% (the band the last rupiah falls in).
(c) The price including VAT is 111% of the pre-tax price, so VAT = 5.55 × 11 ÷ 111 = Rp 0.55 million (pre-tax spending Rp 5.0 million).
📝Practise
Tagged questions are modelled on a real IB question from that session, with our own wording, numbers and context.
1. [2 marks, Paper 2 style] Define the term relative poverty.
2. [10 marks, Paper 1 (a) — modelled on May 2023 SL Paper 1 Q2(a)] Explain why estimates of how many people live in poverty in a country can vary so widely.
3. HL [Paper 3 style] Quintile income shares are 6%, 11%, 16%, 23% and 44%. Calculate the cumulative shares and the Gini coefficient.
4. HL [Paper 3 style] Using the tax bands in the worked example, calculate the average tax rate on taxable income of Rp 100 million and of Rp 250 million, and explain whether the tax is progressive.
5. [15 marks, Paper 1 (b) — modelled on May 2023 SL Paper 1 Q2(b)] Using real-world examples, compare progressive taxation with investment in education as ways of narrowing income inequality.
For taxation: progressive income and wealth taxes directly reduce top incomes and fund transfers and services; Lorenz curve shifting towards the diagonal; Nordic countries combine high progressive taxes with low Ginis.
Limitations: disincentive effects, avoidance and capital flight; narrow tax base in countries with large informal sectors; indirect taxes are regressive; taxation alone does not tackle causes (unequal opportunity).
Alternatives: investment in education and health, conditional cash transfers (PKH, Bolsa Família), minimum wages, anti-discrimination law, UBI. Judgment: taxation is necessary to fund redistribution but the most lasting reductions come from equalizing opportunity; the best mix depends on institutions and tax capacity.
6. Explain two ways in which high income inequality may reduce economic growth.
🔗Go deeper — other people’s work
These are external resources, not mine. If one stops working, tell me and everything above it on this page still stands.
- World Bank Poverty and Inequality Platform — poverty rates and Gini coefficients by country.
- OPHI and UNDP — the global Multidimensional Poverty Index report.
- SMERU Research Institute — independent research on poverty and social protection in Indonesia.