Benefits of international trade
🎯What you need to be able to do
- Explain the benefits of international trade: competition, lower prices, greater choice, access to resources, foreign exchange, larger markets, economies of scale, and more efficient resource allocation and production.
- Draw free-trade diagrams showing exports when the world price is above the domestic price, and imports when it is below.
- HL Calculate from a diagram the quantity of exports and imports, import expenditure and export revenue.
- HL Explain absolute and comparative advantage, opportunity costs, gains from trade and the sources of comparative advantage; draw linear PPCs showing gains from specialization; calculate opportunity costs to identify comparative advantage; evaluate the limitations of the theory.
📚The economics
Benefits of international trade
- Increased competition: domestic firms face foreign rivals, so they must cut costs and innovate; monopoly power is reduced.
- Lower prices for consumers, from cheaper imports and competitive pressure.
- Greater choice: goods that cannot be made at home (Indonesian consumers buy wheat, which the tropics grow poorly; Europeans buy coffee and cocoa).
- Acquisition of resources: countries lacking oil, minerals, technology or capital goods can obtain them.
- More foreign exchange earnings from exports, which pay for imports of capital goods and help development.
- Access to larger markets: firms can sell far beyond a small domestic market.
- Economies of scale: producing for world markets lowers average costs.
- More efficient resource allocation and production: countries specialize in what they do relatively best (comparative advantage), so world output rises.
- Also: transfer of technology and ideas, and closer political ties.
Free trade diagrams
Start from a domestic market with domestic demand and supply. With free trade, a small country can buy or sell as much as it likes at the world price (Pw), which is set in world markets.
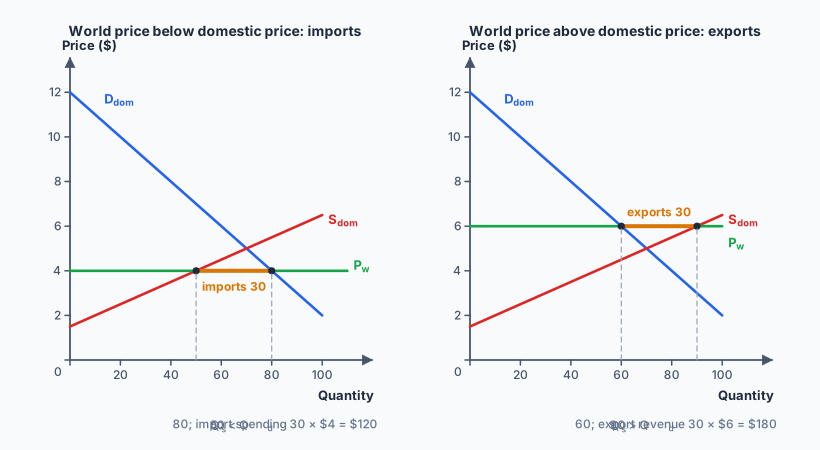
Domestic quantity supplied falls to Qs; quantity demanded rises to Qd; the gap Qd − Qs is imported. Consumers gain (lower price); domestic producers lose. HL Import expenditure = Pw × imports.
Domestic producers expand to Qs; domestic consumers buy only Qd; the excess Qs − Qd is exported. Producers gain, domestic consumers pay more. HL Export revenue = Pw × exports.
In both cases total social surplus is greater than without trade: the gains to the winners exceed the losses to the losers.
Absolute and comparative advantage HL
a country can produce more of a good with the same resources than another country (or the same amount with fewer resources). Adam Smith’s argument for trade.
a country can produce a good at a lower opportunity cost than another country. David Ricardo (1817) showed that trade based on comparative advantage benefits both countries, even if one has an absolute advantage in everything.
Gains from trade: if each country specializes (fully or partly) in the good in which it has a comparative advantage and trades, total world output rises, and both countries can consume outside their own PPC. The terms of trade must lie between the two countries’ opportunity costs for both to gain.
Sources of comparative advantage: differences in factor endowments (land, climate, natural resources: Indonesia’s palm oil and nickel; labour abundance for labour-intensive goods); human capital and technology; infrastructure; institutions; and experience/economies of scale built over time (dynamic comparative advantage).
Limitations of the theory:
- Assumptions: constant opportunity costs (straight-line PPCs), no transport costs, perfect mobility of factors within a country, perfect competition and information, no trade barriers. In reality costs rise with specialization, transport is costly, and resources are not easily moved from rice farming to electronics.
- Structural unemployment in industries that lose out.
- Overspecialization makes a country vulnerable to price swings or demand collapses (commodity dependence, 4.9).
- Static: a country may lock itself into low-value primary production when it could develop new advantages.
- Distribution: gains may be unevenly shared within and between countries.
- Ignores externalities (the environmental cost of producing the export) and strategic goods (food and energy security).
✏️Worked example HL
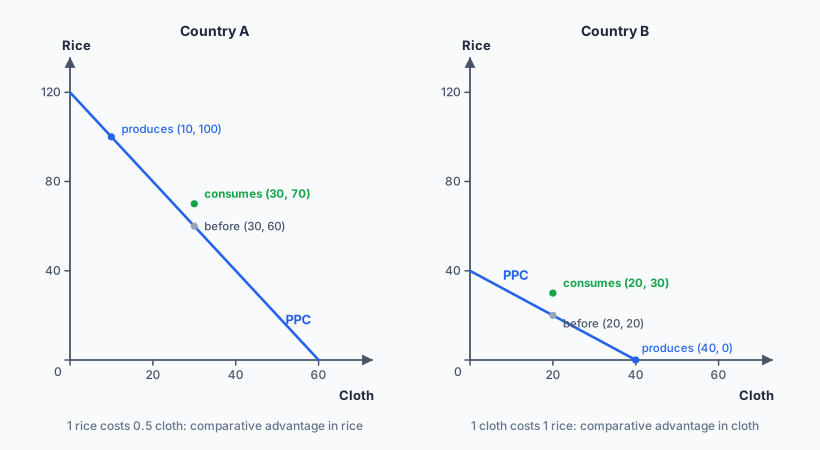
(a) Identify absolute and comparative advantage.
(b) Show that specialization and trade at 1 bale = 1.5 tonnes can benefit both.
(a) A has an absolute advantage in both goods (120 > 40, 60 > 40). Opportunity costs:
A has the lower opportunity cost of rice: comparative advantage in rice. B has the lower opportunity cost of cloth (1 < 2): comparative advantage in cloth.
(b) Before trade: A produces and consumes (30 cloth, 60 rice); B (20 cloth, 20 rice). Total: 50 cloth, 80 rice. After specialization: B produces only cloth (40), A produces 10 cloth and 100 rice. Total: 50 cloth, 100 rice: 20 tonnes more rice with the same cloth. A exports 30 rice for 20 cloth (1 cloth = 1.5 rice):
📝Practise
Tagged questions are modelled on a real IB question from that session, with our own wording, numbers and context.
1. [2 marks, Paper 2 style] Define the term comparative advantage.
2. HL [Paper 3 style] Domestic demand for wheat is 90 million tonnes and domestic supply 30 million tonnes at the world price of $250 per tonne. Calculate imports and import expenditure.
3. HL Country X can make 50 phones or 25 laptops; Country Y can make 30 phones or 10 laptops. Identify each country’s comparative advantage.
4. [10 marks, Paper 1 (a) — modelled on November 2023 HL Paper 1 Q3(a)] Using a numerical example, explain why two countries can both gain from trade even if one is more productive in every good.
5. [10 marks, Paper 1 (a) — modelled on May 2022 HL Paper 1 Q3(a)] Explain why a country that specializes according to its comparative advantage may still face economic problems.
6. [4 marks, Paper 2 style] Using a free-trade diagram, explain how cheaper world prices of soybeans affect domestic soybean farmers and tofu makers in Indonesia.
🔗Go deeper — other people’s work
These are external resources, not mine. If one stops working, tell me and everything above it on this page still stands.
- The Atlas of Economic Complexity (Harvard Growth Lab) — what each country exports and how that has changed.
- WTO — World Trade Statistical Review.
- Paul Krugman, Ricardo’s Difficult Idea — a short essay on why comparative advantage is so often misunderstood.