Types of trade protection
🎯What you need to be able to do
- Draw and explain the effect of a tariff on price, production, consumption, expenditures, revenues and welfare.
- Draw and explain the effect of a quota, and of a subsidy (including export subsidies), on the same variables.
- Explain administrative barriers: standards and regulations.
- Evaluate the effects on markets and stakeholders.
- HL Calculate from a diagram the effects on stakeholders of tariffs, quotas and subsidies.
📚The economics
All three diagrams use domestic demand running from $12 and domestic supply from $1.50, with a world price of $3. Under free trade: domestic producers supply 30 units, consumers buy 90, and 60 are imported.
Tariffs
A tariff is a tax on imported goods. It raises the domestic price of imports to Pw + tariff. The US tariffs on steel (2018) and on many Chinese goods, and the broad US tariffs of 2025, are prominent examples; Indonesia applies tariffs on many consumer goods.
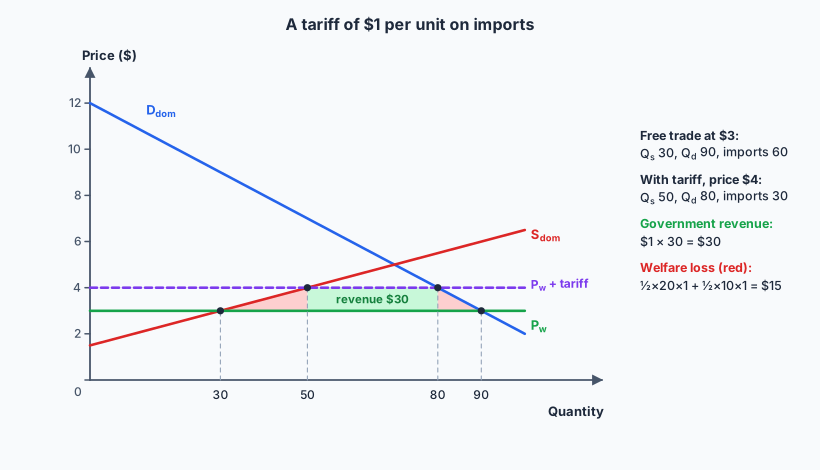
pay more ($3 → $4) and buy less (90 → 80); consumer surplus falls; less choice.
sell more (30 → 50) at a higher price; revenue rises from $90 to $200; producer surplus rises; jobs protected.
earns tariff revenue: $1 × 30 = $30.
export less (60 → 30); their revenue falls from $180 to $90.
welfare loss: the production triangle (inefficient domestic firms replace cheaper imports) and the consumption triangle (consumers priced out): ½ × 20 × 1 + ½ × 10 × 1 = $15.
Quotas
A quota is a legal limit on the quantity (or value) of a good that may be imported. Indonesia uses import quotas and licences for goods such as rice, sugar, beef and garlic.
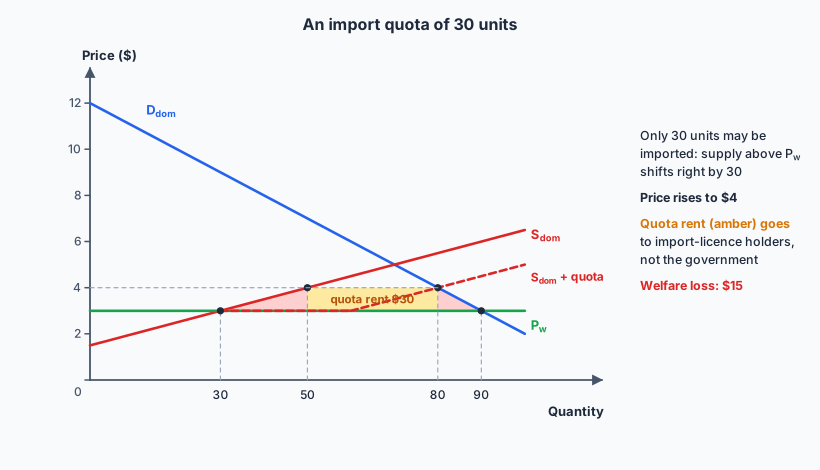
- The effects on consumers, domestic producers and society are like a tariff of equal size.
- The difference: the area that was tariff revenue becomes quota rent (30 × $1 = $30), earned by whoever holds import licences (domestic importers or foreign exporters), not the government. Licences can invite corruption.
- With a quota, further increases in demand raise the price rather than imports: the quantity is fixed.
Subsidies
A production subsidy is a payment to domestic producers per unit, which lowers their costs so they can compete with imports. An export subsidy is a payment per unit exported, which makes exports cheaper abroad.
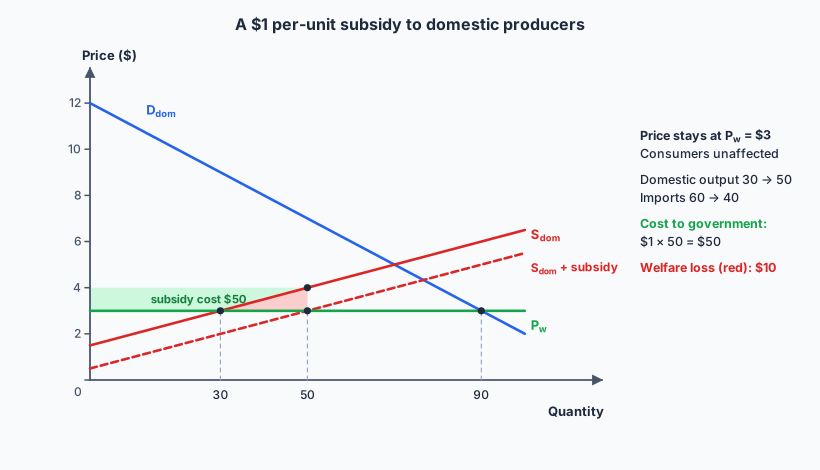
- Consumers: unaffected: price stays at Pw, consumption 90.
- Domestic producers: output 30 → 50; they receive $4 per unit ($3 + $1); revenue $200.
- Government: cost $1 × 50 = $50, with an opportunity cost (taxpayers pay).
- Foreign producers: imports fall 60 → 40.
- Society: welfare loss of ½ × 20 × 1 = $10 from inefficient domestic production. No consumption loss, which is why economists see subsidies as less distorting than tariffs, though costly to taxpayers.
- Export subsidies can depress world prices and harm farmers in poorer countries; they are restricted under WTO rules.
Administrative barriers
Rules that are not taxes or quotas but make importing harder: product standards and regulations (safety, health, labelling, environmental and halal certification rules), complex customs procedures and paperwork, slow inspections, and local-content requirements. Many are legitimate (protecting health), but they can be used as disguised protection. The EU’s deforestation regulation, which requires proof that palm oil and other commodities are not linked to deforestation, is seen by Indonesia and Malaysia as a barrier to their exports; the EU sees it as an environmental standard.
✏️Worked example HL
(d) Tariff revenue = $1 × (80 − 50) = $30.
(e) Welfare loss = ½ × (50 − 30) × 1 + ½ × (90 − 80) × 1 = 10 + 5 = $15.
📝Practise
Tagged questions are modelled on a real IB question from that session, with our own wording, numbers and context.
1. [2 marks, Paper 2 style] Define the term quota.
2. HL [Paper 3 style] At a world price of $5, Qd = 400 and Qs = 150. A tariff of $2 raises the price to $7, where Qd = 340 and Qs = 210. Calculate tariff revenue, the change in import spending on foreign goods, and the welfare loss.
3. [4 marks, Paper 2 style] Using an international trade diagram, explain how a tariff on imported rice raises revenue for the government.
4. [15 marks, Paper 1 (b) — modelled on November 2023 SL Paper 1 Q3(b)] Using real-world examples, discuss the effects on different stakeholders of a tariff on imported steel.
Tariff diagram with all stakeholders. Winners: domestic producers and their workers, the government (revenue). Losers: consumers (higher prices, regressive if on staples), firms using the import as an input (steel tariffs raised costs for car makers), foreign producers, society (welfare loss).
Wider effects: retaliation (the US–China tariffs from 2018), less incentive to be efficient, possible job gains in the short run versus losses elsewhere.
Judgment: depends on elasticities, size of the tariff, whether it is temporary (infant industry) and whether it provokes retaliation; usually net costs to the imposing country.
5. [10 marks, Paper 1 (a) — modelled on November 2024 HL Paper 1 Q3(a)] Explain why abolishing a limit on imported cars could worsen a country’s current account balance.
6. Compare the effects of a tariff and a production subsidy of the same size on consumers and on the government.
🔗Go deeper — other people’s work
These are external resources, not mine. If one stops working, tell me and everything above it on this page still stands.
- WTO Tariff Download Facility and World Tariff Profiles — applied tariffs by country and product.
- Peterson Institute for International Economics — analysis of the US–China tariffs and their costs.
- Global Trade Alert — a database of new protectionist and liberalizing measures worldwide.