Profitability and liquidity ratio analysis
🎯What you need to be able to do
- Calculate and interpret gross profit margin, profit margin and return on capital employed (ROCE).
- Calculate and interpret the current ratio and acid test (quick) ratio.
- Evaluate possible strategies to improve these ratios.
📚The business management
Profitability ratios
How much of each dollar of sales is left after the direct cost of the goods sold. Depends on pricing and on the cost of materials and direct labour.
How much of each dollar of sales is left after all operating costs, including overheads. A big gap between GPM and profit margin points to high expenses.
The return the business earns on all the long-term capital invested in it: the key measure of how efficiently capital is used. Compare it with the interest rate on savings or loans: a ROCE below the cost of borrowing suggests capital could be better used elsewhere.
Liquidity ratios
Liquidity is the ability to pay short-term debts as they fall due. A profitable business can still fail if it runs out of cash (3.7).
A common guide is about 1.5 to 2: below 1, the business may struggle to pay its debts; well above 2, cash may be tied up unproductively in stock or idle balances.
A stricter test, excluding stock because it may be slow or hard to sell. A guide is about 1. Supermarkets can operate safely below 1 because their stock sells fast and customers pay in cash.
All benchmarks depend on the industry; the most useful comparisons are with the same business over time and with competitors.
Strategies to improve the ratios
raise prices (if demand is price inelastic); find cheaper suppliers or negotiate bulk discounts; reduce waste; shift the product mix towards higher-margin products. Risks: lost sales, lower quality.
everything above, plus cut overheads: cheaper premises, less waste in marketing, delayering, energy efficiency. Risks: cuts may damage morale, service or growth.
increase profit (as above) or reduce capital employed: sell unused assets, repay debt. Risks: selling assets may limit future capacity.
sell unused assets or sale-and-leaseback; collect debts faster (discounts for early payment, factoring); reduce stock levels (JIT); negotiate longer credit from suppliers; convert overdraft into a long-term loan; inject new share capital.
idle cash earns little: invest in productive assets, repay expensive debt, or return cash to shareholders.
✏️Worked example
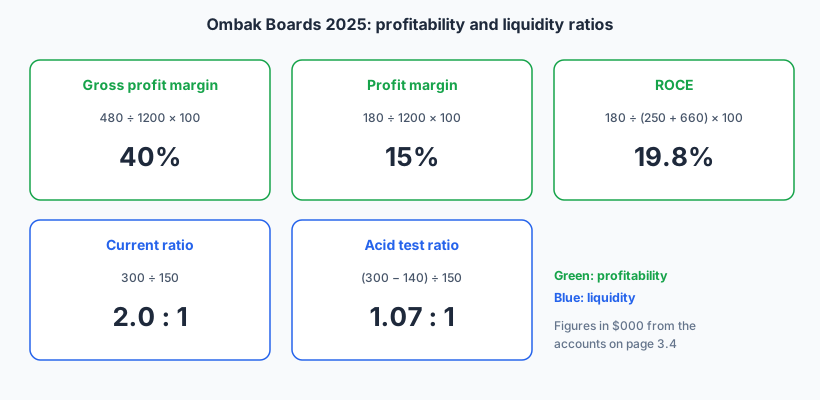
Comment: Ombak’s GPM is lower than the competitor’s (40% vs 45%), so its direct costs are relatively high or its prices lower; but its profit margin is higher (15% vs 12%), so it controls overheads better. A ROCE of almost 20% is a strong return, well above typical interest rates. Liquidity is healthy: a current ratio of 2 and acid test just above 1 mean it can meet short-term debts, and it is more liquid than the competitor. It could look for cheaper materials to raise GPM.
📝Practise
Work through these on paper, then reveal the answer.
1. [2 marks] Sales $600 000, cost of sales $390 000. Calculate the gross profit margin.
2. [2 marks] Current assets $84 000 (including stock $39 000); current liabilities $60 000. Calculate the current and acid test ratios.
3. [2 marks] PBIT $45 000; non-current liabilities $100 000; equity $200 000. Calculate ROCE.
4. [4 marks] A café’s gross profit margin is stable at 65% but its profit margin fell from 18% to 9%. Explain what this suggests and one possible response.
5. [4 marks] Explain why a very high current ratio (say 4 : 1) may not be good.
6. [10 marks] A retailer’s acid test ratio has fallen to 0.5. Discuss strategies it could use to improve its liquidity.
Options: chase debtors or offer discounts for early payment (quick, but cuts revenue); reduce stock through promotions or JIT ordering (frees cash, but risks stock-outs); negotiate longer supplier credit (costless, but may damage relationships); sale and leaseback of premises (large cash inflow, but ongoing rent and loss of the asset); replace the overdraft with a long-term loan (cuts current liabilities, but adds interest); new equity (no repayment, but dilution).
Evaluation: note that a retailer with fast-selling stock can operate with a low acid test ratio, so compare with competitors. A combination of stock reduction and supplier negotiation is quick and cheap; structural measures suit a persistent problem.
🔗Go deeper — other people’s work
These are external resources, not mine. If one stops working, tell me and everything above it on this page still stands.
- AccountingCoach — financial ratios explained with examples.
- Annual reports of listed companies — practise calculating ratios from real accounts.
- Investopedia — industry benchmarks for margins and liquidity ratios.