Toolkit: SWOT, STEEPLE, Ansoff, BCG and Porter
🎯What you need to be able to do
- Construct and apply a SWOT analysis and a STEEPLE analysis to a given business.
- Apply the Ansoff matrix to evaluate growth strategies.
- Apply the BCG matrix to analyse a product portfolio.
- HL Apply Porter’s generic strategies to analyse how a business competes.
- Evaluate the usefulness and limitations of each tool.
📚The business management
How to use a tool in an exam answer
Examiners reward application: every point must come from the case, not a generic list. Construct the tool from the evidence, analyse what it shows (which factors matter most and why), then use it to support a decision. Finish by noting a limitation: a tool is a snapshot based on the information available.
SWOT analysis
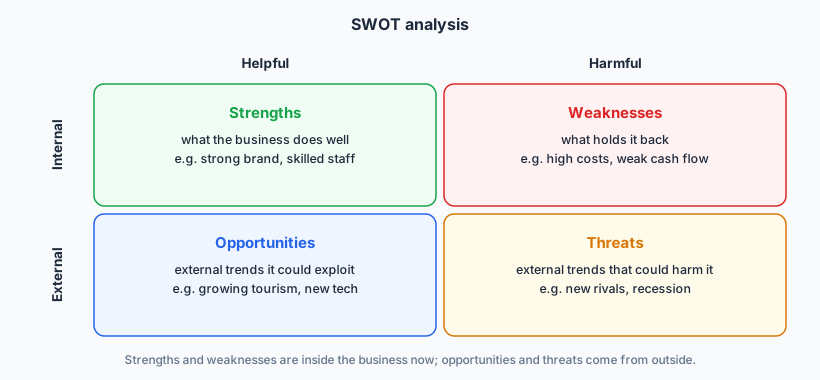
Uses: a quick overview of the business’s position for strategic planning, before choosing a strategy (match strengths to opportunities; fix weaknesses that expose it to threats). Limitations: subjective; a list without weighting; the same factor can be a strength and a weakness; quickly out of date; says nothing about what to do next unless you analyse it.
STEEPLE analysis
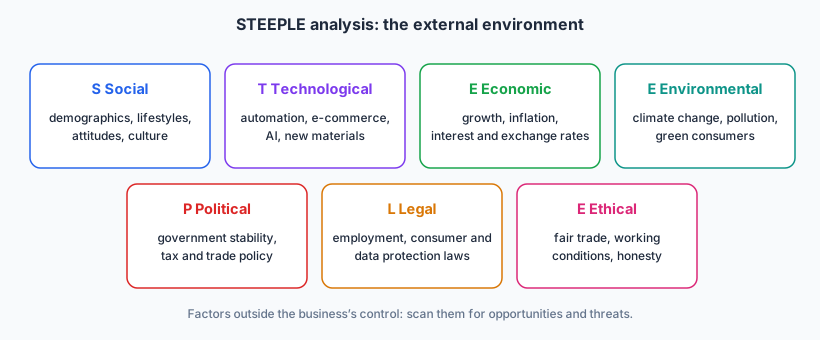
STEEPLE scans the external environment in a structured way, feeding the opportunities and threats of a SWOT. It is especially useful before entering a new market or country (4.6). Limitations: factors overlap (a carbon tax is political, legal and environmental); the environment changes fast; it can become a long list without prioritizing the factors that matter most.
The Ansoff matrix
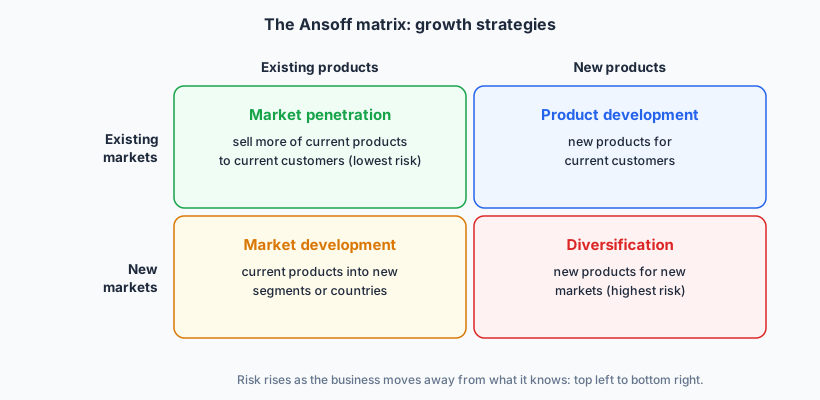
- Market penetration: more promotion, loyalty schemes, lower prices to win share. Lowest risk, but limited in a saturated market.
- Product development: new or improved products for existing customers; uses customer knowledge, needs R&D (5.8).
- Market development: new segments, regions or countries for existing products; uses existing products, but the business lacks market knowledge.
- Diversification: new products in new markets; spreads risk across markets, but both elements are unfamiliar, so it is the riskiest.
Limitations: shows risk only in broad terms; ignores competitors’ reactions and the business’s resources; categories blur (is a new flavour a new product?).
The BCG matrix
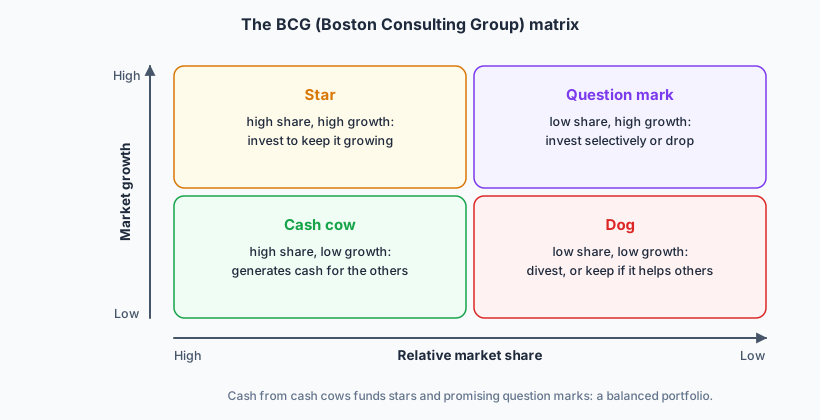
The BCG matrix places each product (or business unit) by the growth rate of its market and its relative market share (its share divided by the largest rival’s). A balanced portfolio uses the cash from cash cows to build stars and selected question marks, while dogs are reviewed. Products tend to move anticlockwise, from question mark to star to cash cow, and link to the product life cycle.
Limitations: high share does not guarantee profit; a “dog” may still be profitable or support other products; defining the market is subjective; it is a snapshot; it considers only two variables.
Porter’s generic strategies HL
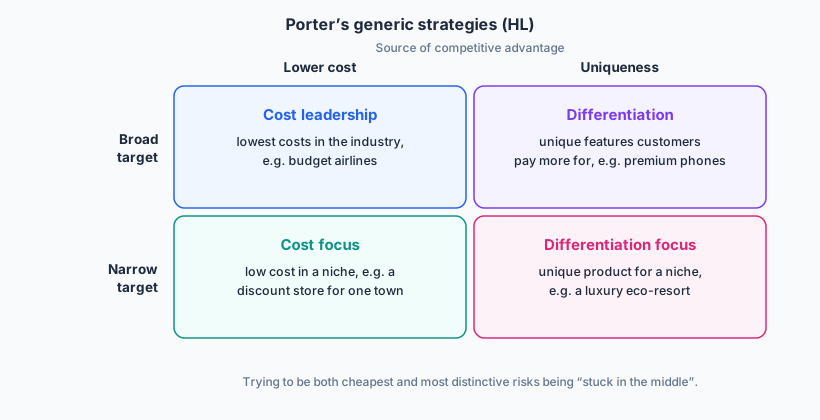
Michael Porter argued that a business gains competitive advantage in one of two ways, lower cost or differentiation, applied to a broad market or a narrow segment (focus). Cost leaders need economies of scale and lean methods; differentiators need branding, quality and R&D. A firm that tries to do both without excelling at either risks being stuck in the middle.
Limitations: some firms do achieve low cost and differentiation together; advantages can be copied; it does not say how to implement the strategy.
✏️Worked example
SWOT. Strengths: reputation for handmade quality; Bali brand image. Weaknesses: higher costs; one shop, small scale. Opportunities: growing surf tourism; airport capacity; weak rupiah makes exports cheaper for Australian buyers. Threats: cheaper online foam boards; tourist demand is volatile.
Ansoff. Selling existing boards to a new country is market development: medium risk. Ombak knows its product but not Australian retail, where many local shapers compete.
Porter HL. Ombak cannot be a cost leader against mass-produced boards; its strategy is differentiation focus: premium handmade boards for committed surfers. In Australia it must keep that position rather than compete on price.
Judgment: the proposal matches a strength (quality, Bali image) to an opportunity (weak rupiah), so it is reasonable if Ombak starts small (a few specialist shops) and protects its premium positioning. The analysis relies on current exchange rates, which may change.
📝Practise
Work through these on paper, then reveal the answer.
1. [2 marks] Distinguish between market development and product development.
2. [2 marks] Describe a cash cow in the BCG matrix.
3. [4 marks] A coffee chain in Indonesia wants to open in Malaysia. Explain two STEEPLE factors it should consider.
4. [4 marks] Explain two limitations of the BCG matrix for a business deciding which products to drop.
5. HL [4 marks] Explain the risk of being “stuck in the middle” for a mid-price hotel chain.
6. [10 marks] Using the Ansoff matrix, discuss whether a Balinese spa brand should diversify into selling herbal skincare products in supermarkets.
Analysis: new product (manufactured skincare) in a new market (supermarket shoppers, not spa visitors): diversification, the highest risk. It could be seen partly as product development if targeted at existing spa customers.
For: brand recognition from the spa; spreads risk away from tourist-dependent services; scalable; natural-products trend.
Against: no manufacturing or retail experience; strong competitors with scale; supermarket margins and listing fees; brand damage if quality slips; regulatory approval for cosmetics.
Judgment: lower the risk by starting with sales in its own spas and online (product development), outsourcing production, and entering supermarkets only once demand is proven.
🔗Go deeper — other people’s work
These are external resources, not mine. If one stops working, tell me and everything above it on this page still stands.
- Michael Porter — Competitive Strategy (1980), the source of the generic strategies.
- Igor Ansoff — “Strategies for Diversification”, Harvard Business Review (1957).
- Boston Consulting Group — its own articles on the growth-share matrix.