Toolkit: business plans, decision trees, statistics and circular models
🎯What you need to be able to do
- Explain the purpose and main elements of a business plan.
- Construct and interpret a decision tree, calculating expected values.
- Calculate and interpret descriptive statistics: mean, median, mode, quartiles and standard deviation; read bar charts, pie charts and infographics.
- Explain the circular business models and evaluate their use.
📚The business management
The business plan
A business plan is a document setting out a business’s objectives and how it will achieve them. Typical elements:
- the business idea, vision and mission, and legal structure (1.2);
- market research, target market and competitors (4.4);
- the marketing plan and the seven Ps;
- operations: location, suppliers, production methods;
- human resources: owners, key staff, organization;
- finance: sources of finance, cash flow forecast, break-even and projected accounts.
Why write one: to secure finance from banks and investors, to test whether the idea is viable, and to set targets to measure progress against. Limitations: based on forecasts that may be wrong; can become out of date quickly; time-consuming; may give false confidence.
Decision trees
A decision tree maps the options available, the possible outcomes of each, their probabilities and their financial results.
- Square: a decision point (the business chooses).
- Circle: a chance node (outcomes happen with given probabilities, which add up to 1).
- Expected value (EV) at each chance node = sum of (probability × outcome).
- Net EV = EV − cost of the option. Choose the highest net EV; mark rejected branches with a double line (//).
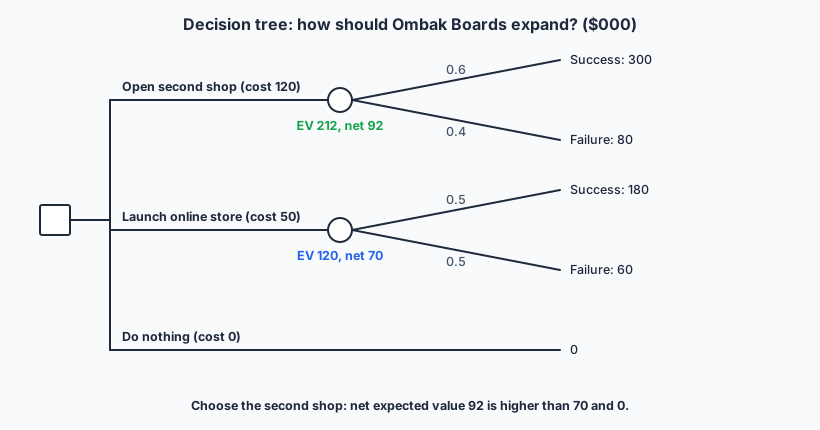
Strengths: sets out options clearly; forces managers to consider risks and probabilities; quantitative basis for comparison. Limitations: probabilities and outcomes are estimates, often subjective; ignores qualitative factors (fit with objectives, staff, brand); the EV is an average, and the actual result will be one of the outcomes, not the EV; ignores the time value of money and attitudes to risk (the shop could return only 80).
Descriptive statistics
- Mean: sum of values ÷ number of values. Uses all the data but is pulled by extreme values.
- Median: the middle value when the data is in order. Not affected by extremes.
- Mode: the most frequent value. Useful for stock decisions (the most popular size).
- Quartiles: split ordered data into four equal parts; the interquartile range (Q3 − Q1) shows the spread of the middle half.
- Standard deviation: the typical distance of values from the mean; a large value means data is widely spread (less predictable).
- Bar charts compare categories; pie charts show shares of a whole; infographics combine images, charts and text to communicate data quickly to non-specialists.
Circular business models
A traditional linear model takes resources, makes products and throws them away. A circular model keeps products and materials in use for as long as possible, cutting waste and dependence on new resources.
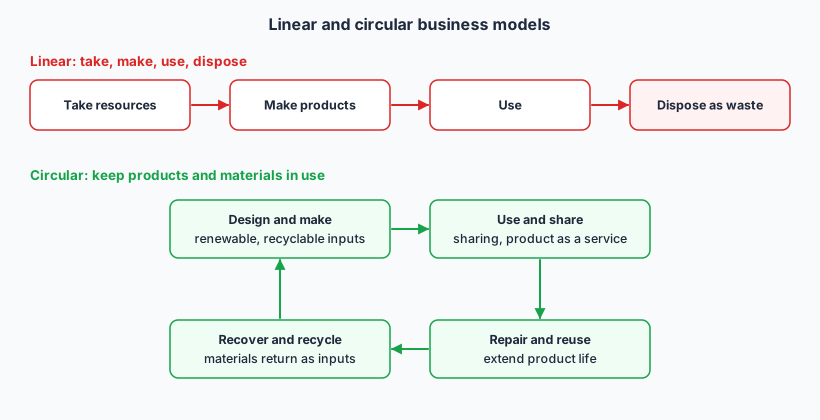
- Circular supply models: replacing scarce or harmful inputs with renewable, bio-based or recycled ones (packaging from plant fibre).
- Resource recovery models: recovering materials or energy from waste and by-products (turning coconut husks into fibre products).
- Product life extension models: repair, refurbishing, upgrades and resale (refurbished phones, surfboard repair services).
- Sharing models: making better use of products by sharing access (car-sharing, co-working spaces, rental platforms).
- Product service system models: selling the use or performance of a product rather than the product itself (leasing, subscriptions).
Benefits: lower material costs, new revenue streams, customer loyalty, stronger CSR image, resilience to resource prices, meeting regulations. Limitations: redesign and reverse logistics are costly; customers may prefer new products; recycled inputs can be more expensive or lower quality; harder to scale.
✏️Worked example
Ordered: 3, 4, 5, 5, 5, 6, 7, 8, 12. Mean = 55 ÷ 9 = 6.1. Median (5th value) = 5. Mode = 5.
Quartiles (median of each half, excluding the median): Q1 = median of 3, 4, 5, 5 = 4.5; Q3 = median of 6, 7, 8, 12 = 7.5. IQR = 7.5 − 4.5 = 3.
Standard deviation (calculator, population): 2.5 boards.
Comment: the mean is pulled up by one unusual day (12, perhaps a surf competition). The median and mode (5) better represent a typical day, so plan around 5 boards, with buffer stock to cover the spread (SD 2.5) and extra stock for known events.
📝Practise
Work through these on paper, then reveal the answer.
1. [2 marks] State two reasons for writing a business plan.
2. [3 marks] A campaign costs $20 000 and has a 0.7 chance of earning $50 000 and a 0.3 chance of earning $10 000. Calculate its net expected value.
3. [2 marks] Explain why the median may be more useful than the mean for employee salaries in a company.
4. [4 marks] Explain two circular business models a hotel could adopt.
5. [4 marks] Explain two limitations of decision trees.
6. [10 marks] Discuss whether a fashion retailer should adopt a product service system (clothing rental subscription).
For: recurring subscription revenue; appeals to sustainability-minded and budget-conscious customers; each garment earns revenue many times; data on preferences; CSR benefits.
Against: cleaning, repair and reverse-logistics costs; damage and loss; customers may prefer ownership; cannibalizes sales; needs new systems and skills.
Judgment: worth piloting for occasion wear (high price, rarely worn) in urban markets, alongside normal sales, before committing fully.
🔗Go deeper — other people’s work
These are external resources, not mine. If one stops working, tell me and everything above it on this page still stands.
- Ellen MacArthur Foundation — case studies of circular business models.
- Khan Academy — mean, median, interquartile range and standard deviation.
- Tutor2u — decision trees with worked examples.