Sales forecasting
🎯What you need to be able to do
- HL Evaluate the benefits and limitations of sales forecasting.
- HL Interpret a sales trend and seasonal variation (and, with the toolkit, extrapolation and linear regression).
📚The business management
What a sales forecast is
A sales forecast is a prediction of future sales volume or revenue over a given period, based on past data, market research and expected changes in the market. Past data usually contain:
- a trend: the underlying long-term direction;
- seasonal variation: regular ups and downs within a year (tourism peaks, festive seasons such as Ramadan and Lebaran, school terms);
- cyclical variation: longer swings with the business cycle;
- random variation: one-off events (a volcanic eruption closing an airport, a viral post).
Finding the trend: moving averages
A moving average smooths out seasonal and random variation. For quarterly data, add four consecutive quarters (a four-quarter moving total), then average two neighbouring totals and divide by 8 to centre the result on a quarter. The seasonal variation for a quarter is actual sales minus trend.
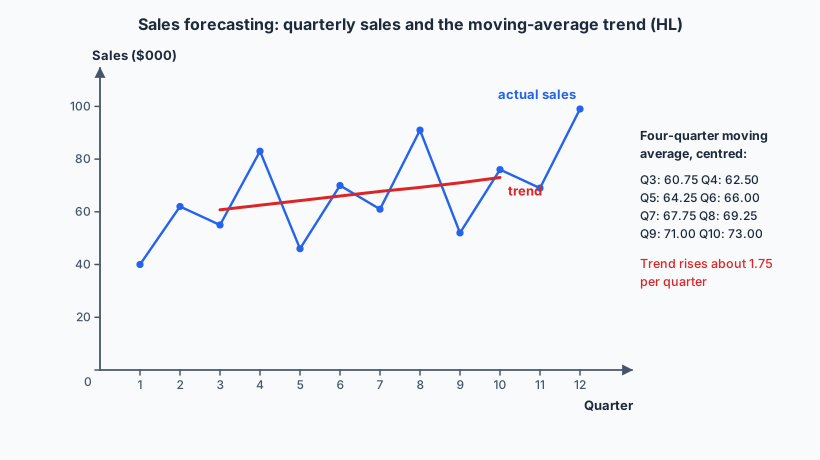
The trend can then be extrapolated (extended) into the future, and the average seasonal variation added back for each quarter, to produce a forecast.
Benefits of sales forecasting
- Operations: plan production capacity and stock levels, avoiding shortages or waste.
- HR: plan recruitment, temporary staff and training (workforce planning).
- Finance: produce cash flow forecasts and budgets; support loan applications.
- Marketing: time promotions and set targets.
- Strategy: reduce uncertainty in decisions such as expansion.
Limitations
- Based on the past, which may not repeat: new competitors, changing tastes, technology and shocks (a pandemic) break trends.
- The further ahead, the less reliable the forecast.
- Data quality: new products and new businesses have little history.
- Qualitative factors (a competitor’s campaign, a change in regulation) are hard to quantify.
- Bias: managers may be over-optimistic to justify plans.
- Costs time and money; complex methods give an illusion of precision.
✏️Worked example HL
(a) Four-quarter totals: 40 + 62 + 55 + 83 = 240; 62 + 55 + 83 + 46 = 246. Centred trend = (240 + 246) ÷ 8 = 60.75.
(b) Trend for Q12 ≈ 73.00 + 2 × 1.75 = 76.5. Forecast = 76.5 + 21 = about $97 500 (actual turned out to be 99, close to the forecast).
(c) Fairly reliable in the short term: a clear, steady trend and a regular seasonal pattern. But it assumes tourism continues to grow at the same rate; a new competitor, a drop in arrivals or bad weather could break the pattern, so the café should combine it with market knowledge and update it each quarter.
📝Practise
All HL.
1. [2 marks] Define the term sales forecasting.
2. [2 marks] Distinguish between the trend and seasonal variation.
3. [2 marks] Sales in four consecutive quarters are 120, 150, 110, 180, and the next quarter is 130. Calculate the two four-quarter moving totals and the centred average.
4. [4 marks] Explain two ways a hotel could use a sales forecast.
5. [4 marks] Explain two reasons why a sales forecast for a new product may be unreliable.
6. [10 marks] Discuss the view that sales forecasting is of little use in a fast-changing market such as mobile games.
For the view: trends change quickly, hits are unpredictable, product lives are short, and past data quickly become irrelevant.
Against: forecasts still guide server capacity, marketing spend and cash flow; short-term forecasts using real-time data (downloads, user retention) can be accurate; scenario planning (best, expected, worst) manages uncertainty.
Judgment: long-range forecasts are unreliable, but frequent, short-range, data-driven forecasts remain valuable if updated and used alongside judgment.
🔗Go deeper — other people’s work
These are external resources, not mine. If one stops working, tell me and everything above it on this page still stands.
- BPS tourism statistics — monthly foreign arrivals to Bali, to see seasonality in real data.
- Khan Academy — Fitting a line to data and extrapolation.
- Tutor2u — moving averages and sales forecasting.