Market research
🎯What you need to be able to do
- Evaluate why and how organizations carry out market research.
- Explain primary research methods: surveys, interviews, focus groups and observations.
- Explain secondary research methods: market analyses, academic journals, government publications, media articles and online content.
- Explain the difference between qualitative and quantitative research.
- Explain quota, random and convenience sampling.
📚The business management
Why businesses research markets
- To identify customer needs and gaps in the market (market orientation).
- To estimate demand and forecast sales before launching.
- To understand competitors: prices, products, strengths.
- To test products, prices, packaging and promotions.
- To monitor customer satisfaction and brand image.
- To reduce the risk of costly mistakes and to support finance applications.
Primary research
Primary (field) research collects new, first-hand data for a specific purpose.
- Surveys (questionnaires): set questions online, by phone or in person; many respondents; closed questions give quantitative data. Wording and response bias affect results.
- Interviews: one-to-one, in-depth; rich detail and follow-up questions; time-consuming and interviewer bias possible.
- Focus groups: a small group discusses a product or idea led by a moderator; reveals attitudes and reactions; not representative, and dominant members sway others.
- Observations: watching how customers actually behave (in store, online analytics); shows real behaviour, not what people say; does not explain why.
specific to the firm’s needs; up to date; confidential from competitors.
costly and time-consuming; needs expertise; small samples may be unrepresentative.
Secondary research
Secondary (desk) research uses data that already exist, collected by others.
- Market analyses (reports by research firms), academic journals, government publications (BPS statistics, trade data), media articles, and online content (company websites, reviews, social media).
quick and cheap (often free); large-scale data a small firm could not collect; useful starting point.
may be outdated or not specific; available to competitors; reliability and bias of sources vary; commercial reports can be expensive.
Qualitative and quantitative research
numerical data that can be measured and analysed statistically: “62% of respondents would pay Rp 30 000”. Good for estimating demand and comparing; may miss reasons.
opinions, attitudes and motivations, usually in words: “I prefer it because the packaging feels premium”. Good for understanding why; harder to analyse and generalize.
Sampling
A sample is a subset of the population surveyed. A larger, well-chosen sample is more likely to represent the population but costs more.
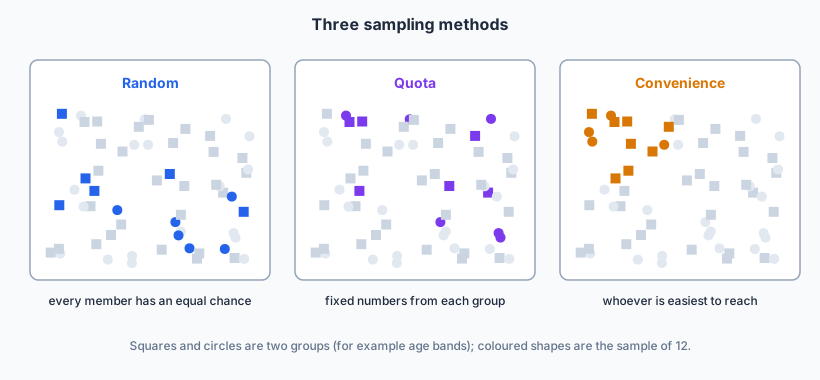
- Random sampling: every member of the population has an equal chance of selection. Reduces bias; needs a list of the population and can by chance under-represent groups.
- Quota sampling: the researcher fills set numbers from each segment (for example 50 men and 50 women aged 18–30), choosing people within each quota. Quick, represents key groups; selection within quotas may be biased.
- Convenience sampling: whoever is easiest to reach (friends, people passing by). Cheap and fast; high risk of bias, so results may not represent the market.
✏️Worked example
Secondary research first (cheap): market reports on ready-meal growth, BPS data on urban incomes and household sizes, competitor websites and online reviews to find complaints about existing products.
Primary research: an online survey of about 300 young professionals using a quota sample (by age band and area) to estimate demand and acceptable prices (quantitative); two focus groups to test flavours and packaging (qualitative); later, a small trial in a few minimarkets with observation of sales.
Evaluation: combining methods balances cost, speed and depth; quota sampling ensures the target segment is covered, although online surveys exclude people less active online.
📝Practise
Work through these on paper, then reveal the answer.
1. [2 marks] Define the term secondary research.
2. [2 marks] Distinguish between quota and random sampling.
3. [4 marks] Explain one advantage and one disadvantage of using a focus group.
4. [4 marks] Explain why a small business might rely mainly on secondary research.
5. [4 marks] Explain why observation may be more reliable than a survey for studying shopping behaviour.
6. [10 marks] Discuss the usefulness of social media data as a source of market research for a fashion brand.
Useful: large volumes of real-time data on trends, reactions and competitors; cheap; direct access to the target segment; analytics measure engagement.
Limitations: users are not representative (younger, more active online); fake accounts and bots; opinions expressed publicly differ from buying behaviour; privacy and ethical concerns; interpretation needs skill.
Judgment: very useful for spotting trends and testing ideas quickly, but should be combined with sales data and structured primary research.
🔗Go deeper — other people’s work
These are external resources, not mine. If one stops working, tell me and everything above it on this page still stands.
- Badan Pusat Statistik (BPS) — free Indonesian statistics on population, income and spending.
- Pew Research Center — examples of well-designed surveys and sampling methods.
- Google Trends — free secondary data on what people search for.