Break-even analysis
🎯What you need to be able to do
- Distinguish between total contribution and contribution per unit.
- Calculate and construct a break-even chart: break-even quantity, profit or loss, margin of safety, target profit output, target profit and target price.
- Analyse the effects of changes in price or cost on the break-even quantity, profit and margin of safety, using graphs and calculations.
- Evaluate the benefits and limitations of break-even analysis.
📚The business management
Contribution
Contribution per unit is what each unit sold adds towards paying fixed costs (and, once they are covered, towards profit). Total contribution is contribution per unit multiplied by the number of units sold.
Break-even quantity
The break-even quantity (BEQ) is the output at which total revenue equals total cost, so profit is zero. The break-even point is that point on the chart; break-even revenue is BEQ × price.
Always round a BEQ up to a whole unit: selling 359.2 units is impossible, and 359 would still be a loss.
The break-even chart
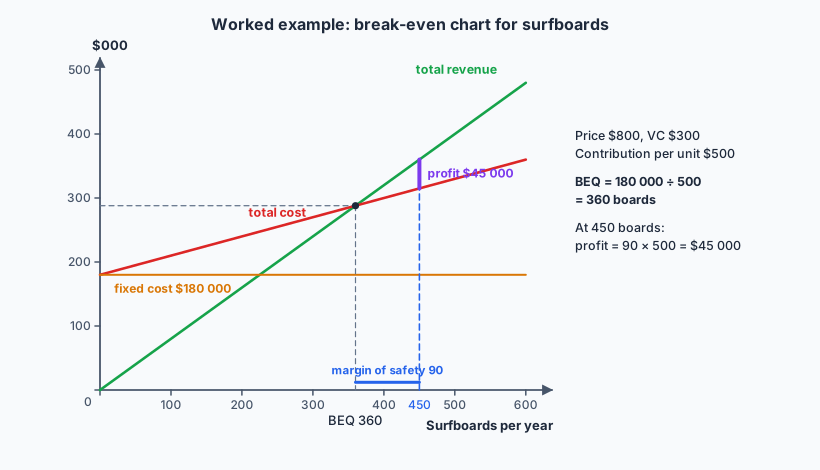
Draw three lines against output: fixed costs (horizontal), total cost (starting at the fixed-cost level and rising by the variable cost per unit) and total revenue (starting at the origin and rising by the price). Where total revenue crosses total cost is the break-even point. The vertical gap between the lines is the loss (to the left) or profit (to the right). Label the axes, the lines and the key values.
Margin of safety
The margin of safety is how far sales can fall before the business makes a loss.
It can be given in units, in revenue (units × price) or as a percentage of output. A negative margin of safety means the business is making a loss.
Target profit and target price
To find the output needed for a target profit, the contribution must cover the fixed costs and the profit:
To find the target price that reaches a target profit at a given output, work backwards: revenue must cover total cost plus the target profit.
Effects of changes
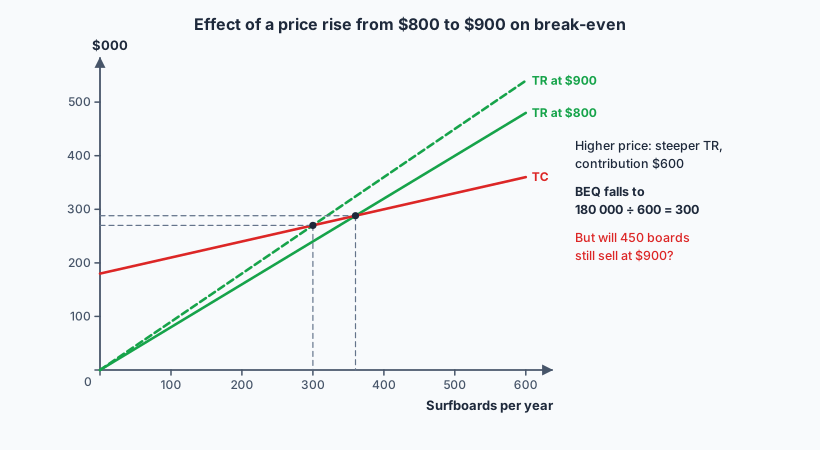
- Price rises: contribution per unit rises, so the BEQ falls; the margin of safety and profit rise if sales volume holds.
- Variable cost per unit rises: contribution per unit falls, so the BEQ rises; margin of safety and profit fall.
- Fixed costs rise: contribution per unit is unchanged, but the BEQ rises; margin of safety and profit fall.
A higher price usually sells fewer units (price elasticity), so the real effect on profit depends on how customers react. On the chart, a price rise makes the total revenue line steeper; a variable-cost rise makes the total cost line steeper; a fixed-cost rise shifts the fixed-cost and total cost lines up in parallel.
Benefits and limitations
quick and simple; shows the output needed to avoid a loss; margin of safety shows risk; useful in business plans for lenders; allows “what if” testing of price and cost changes.
assumes all output is sold; assumes a single price (no discounts) and straight-line costs (no bulk-buying economies); hard to use for firms selling many products; fixed costs are fixed only in the short run; relies on forecasts; ignores qualitative factors.
✏️Worked example
(a) Contribution per unit = 800 − 300 = $500.
(b) BEQ = 180 000 ÷ 500 = 360 boards (break-even revenue 360 × 800 = $288 000).
(c) Margin of safety = 450 − 360 = 90 boards (20% of forecast output).
(d) Profit = 450 × 500 − 180 000 = 225 000 − 180 000 = $45 000. Check: 90 boards beyond break-even × $500 = $45 000.
(e) Target profit output = (180 000 + 70 000) ÷ 500 = 500 boards.
(f) Target price = (180 000 + 70 000) ÷ 450 + 300 = 555.56 + 300 = $855.56, so about $856.
📝Practise
Work through these on paper, then reveal the answer.
1. [2 marks] Distinguish between contribution per unit and total contribution.
2. [2 marks] A café sells coffee at $4 with variable cost $1.50 a cup. Fixed costs are $5000 a month. Calculate the monthly BEQ.
3. [2 marks] The café sells 2600 cups. Calculate its margin of safety and profit.
4. [3 marks] The café’s rent rises by $1000 a month. Calculate the new BEQ and explain the effect on the margin of safety.
5. [2 marks] The café wants a monthly profit of $3000 with the original fixed costs. Calculate the output needed.
6. [10 marks] Discuss the usefulness of break-even analysis to a new eco-resort planning its first year.
Useful: shows the occupancy needed to cover fixed costs (a high share of costs for resorts), supports a loan application, lets the owners test pricing (low and high season rates) and cost scenarios, and the margin of safety shows how exposed it is to a weak tourist season.
Limitations: a new business has no sales history, so forecasts are uncertain; room rates vary by season and channel, so there is no single price; costs may not be linear; revenue from food and activities complicates contribution; it ignores cash flow timing.
Judgment: useful as a starting point and for testing scenarios, but it should be combined with cash flow forecasts and market research.
🔗Go deeper — other people’s work
These are external resources, not mine. If one stops working, tell me and everything above it on this page still stands.
- Tutor2u — break-even analysis revision and calculators.
- Investopedia — Contribution margin and Break-even analysis.
- BBC Bitesize — drawing break-even charts (a good refresher for the graph).