Production planning
🎯What you need to be able to do
- HL Explain the local and global supply chain process.
- HL Distinguish between just-in-time (JIT) and just-in-case (JIC) stock control.
- HL Construct and interpret stock control charts: lead time, buffer stock, reorder level and reorder quantity.
- HL Calculate capacity utilization rate, defect rate, labour productivity, capital productivity, productivity rate and operating leverage.
- HL Calculate cost to buy (CTB) and cost to make (CTM) and use them in a make-or-buy decision.
📚The business management
Supply chains
A supply chain is the sequence of organizations and activities that moves a product from raw materials to the final customer. A local chain keeps suppliers close (shorter lead times, easier control, lower transport emissions); a global chain sources from many countries (lower costs, access to specialists) but is longer and more exposed to disruption: port delays, pandemics, conflict, tariffs and exchange-rate changes.
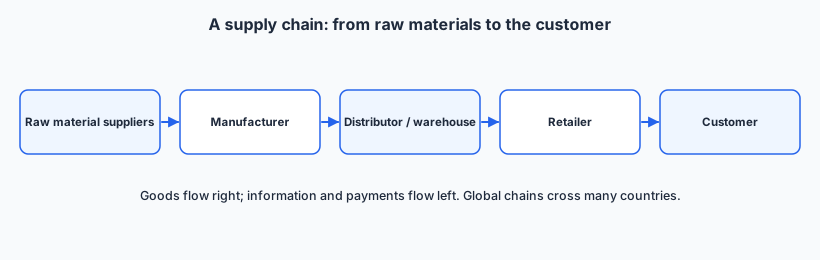
Supply chain management coordinates the chain to cut costs and lead times, keep quality high and make the chain resilient (for example by using more than one supplier).
Just-in-time versus just-in-case
stock arrives only when needed; little or no buffer stock. Lower storage and financing costs, less waste and obsolescence, better cash flow. But: depends on reliable suppliers and transport; one delay can stop production; no spare stock for sudden demand; frequent small orders lose bulk discounts.
large buffer stocks are held in case of delays or demand spikes. Production keeps running, sudden orders can be met, bulk-buying discounts. But: high storage, insurance and opportunity costs; cash tied up; risk of damage, theft and obsolescence.
Many firms now blend the two: JIT for predictable items, larger buffers of critical parts (a lesson from chip shortages after 2020).
Stock control charts
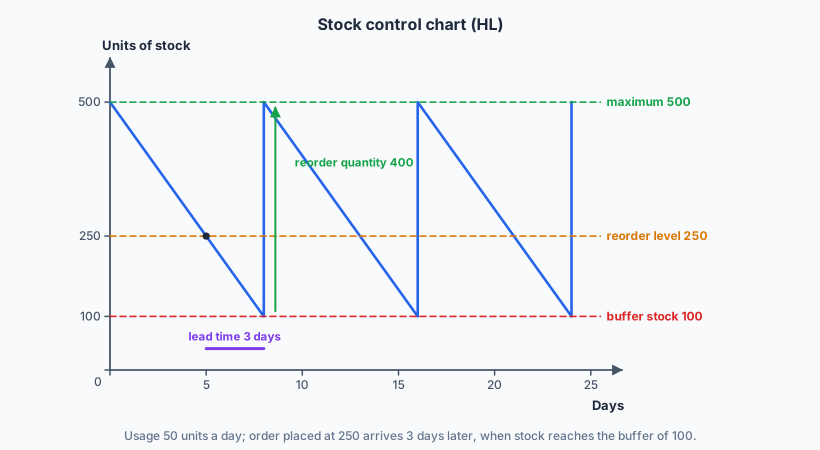
- Buffer stock: the minimum stock held as a safety cushion.
- Lead time: the time between placing an order and receiving it.
- Reorder level: the stock level at which a new order is placed, so it arrives just as stock reaches the buffer.
- Reorder quantity: the amount ordered each time (maximum stock − buffer stock, if the order arrives exactly at the buffer).
- Maximum stock: the highest level stock should reach, limited by space and cost.
Capacity utilization
Productive capacity is the maximum output a business can produce with its current resources.
High utilization spreads fixed costs over more units, lowering unit costs. But near 100% there is no slack for maintenance, extra orders or breakdowns, and staff may be overworked. Low utilization means idle resources and high unit costs; the business may cut capacity (rationalize) or find new markets.
Quality and productivity measures
Higher productivity lowers unit costs and can allow higher wages, lower prices or higher profits. It can be raised through training, better technology, motivation, lean methods and better management; but pushing too hard can hurt quality and morale.
Operating leverage
Operating leverage measures how sensitive operating profit is to a change in sales. It is high when fixed costs are a large share of total costs: after break-even, each extra sale adds a lot of profit; below break-even, losses grow quickly.
An operating leverage of 5 means a 1% change in sales changes operating profit by about 5%.
Cost to make versus cost to buy
where P is the supplier’s price, Q the quantity, FC the fixed cost of making in-house and VC the variable cost per unit. If CTB < CTM, buying is cheaper; if CTM < CTB, making is cheaper. Then weigh qualitative factors: quality control, reliability of the supplier, spare capacity, protecting know-how, and the effect on staff (see outsourcing).
✏️Worked example
(a) Capacity utilization = 450 ÷ 600 × 100 = 75%. Defect rate = 18 ÷ 450 × 100 = 4%. Labour productivity = 450 ÷ (6 × 1800) = 450 ÷ 10 800 = 0.042 boards per hour (about 75 boards per shaper per year).
(b) Total contribution = 450 × 500 = 225 000; operating profit = 225 000 − 180 000 = 45 000. Operating leverage = 225 000 ÷ 45 000 = 5. A 10% fall in sales would cut profit by about 50%.
(c) CTB = 40 × 450 = $18 000. CTM = 6000 + 25 × 450 = $17 250. Making saves $750, a small margin; spare capacity (75%) means it can make them, but the saving could vanish if volumes fall, and a specialist supplier may offer better quality. A marginal case: it could make them if quality can be matched.
📝Practise
Work through these on paper, then reveal the answer.
1. [2 marks] Define the term lead time.
2. [2 marks] A shop uses 40 units a day, holds a buffer of 120 and the lead time is 5 days. Calculate the reorder level.
3. [2 marks] A factory with capacity of 8000 units a month produces 6800. Calculate capacity utilization.
4. [3 marks] A firm can buy 2000 parts at $12 each, or make them with fixed costs of $9000 and variable costs of $7 each. Calculate CTB and CTM and state the cheaper option.
5. [4 marks] Explain two disadvantages of just-in-time stock control for a restaurant in a tourist area.
6. [10 marks] Discuss whether a manufacturer should move from just-in-case to just-in-time stock control.
For JIT: frees cash and storage space, cuts waste and obsolescence, exposes problems, supports lean production and kaizen.
Against: needs reliable, nearby suppliers and good IT; global chains are vulnerable to disruption; loses bulk discounts; no buffer for demand spikes; a stoppage is costly with high operating leverage.
Judgment: depends on supplier reliability, demand stability and the cost of a stoppage. A hybrid (JIT for routine items, buffers of critical parts) is often best.
🔗Go deeper — other people’s work
These are external resources, not mine. If one stops working, tell me and everything above it on this page still stands.
- Tutor2u — stock control, capacity utilization and productivity.
- Investopedia — Operating leverage and Just-in-time (JIT).
- Toyota Production System pages — the origins of JIT.