Toolkit: the HL tools
🎯What you need to be able to do
- HL Construct and interpret a force field analysis.
- HL Interpret Gantt charts; complete and analyse critical path networks: earliest start times, latest finish times, the critical path, and free and total float.
- HL Apply Hofstede’s cultural dimensions to organizations operating across cultures.
- HL Use contribution and absorption costing in decisions such as special orders and closing a product line.
- HL Interpret simple linear regression: scatter diagrams, the line of best fit, correlation and extrapolation.
📚The business management
Force field analysis
Developed by Kurt Lewin, force field analysis lists the driving forces for a change and the restraining forces against it, and scores each (for example 1 to 5). If driving forces outweigh restraining ones, the change is likely to succeed; managers can then strengthen drivers or weaken restraints (training to reduce resistance, see 2.1).
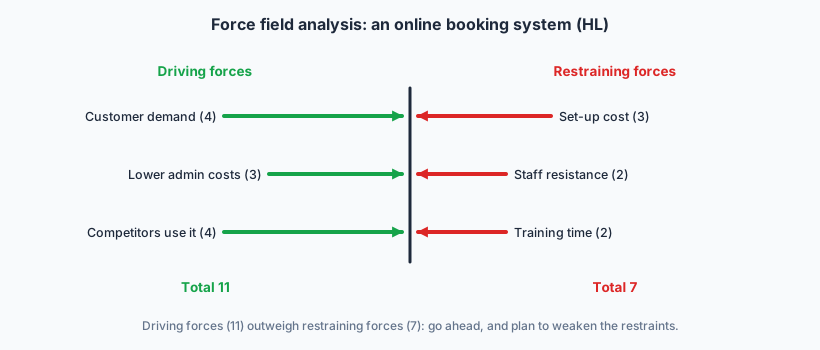
Limitations: scores are subjective; the forces are not independent; it simplifies a complex decision to a single sum.
Gantt charts
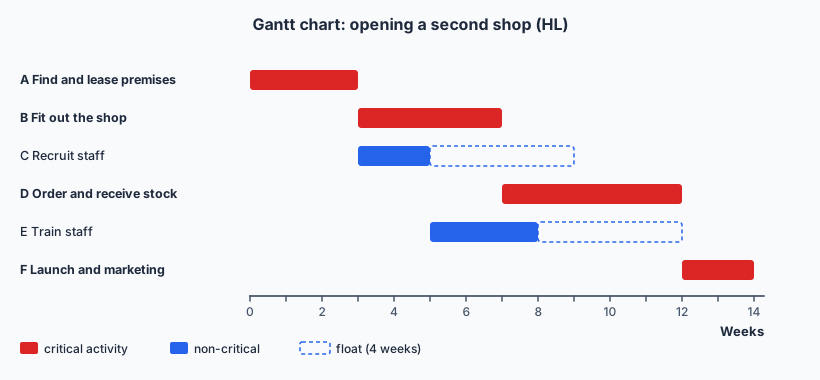
A Gantt chart is a bar chart showing each activity of a project against time, so managers can see what should happen when, which activities run in parallel, and whether the project is on schedule. It is easy to read but, on its own, does not show which activities depend on which.
Critical path analysis
Critical path analysis (CPA) models a project as a network of activities (arrows) and nodes (circles). Each node shows its number, the earliest start time (EST) of the activities that follow it and the latest finish time (LFT) of the activities that end at it.
- ESTs: work left to right. EST = EST of the previous node + duration; where arrows meet, take the largest.
- LFTs: work right to left. LFT = LFT of the next node − duration; where arrows split, take the smallest.
- The critical path is the chain of activities with EST = LFT at every node: any delay to them delays the whole project.
In the exam you complete and analyse a given network (drawing one from scratch is not expected). Two kinds of float:
Total float is how long an activity can be delayed without delaying the whole project; free float is how long it can be delayed without delaying the next activity.
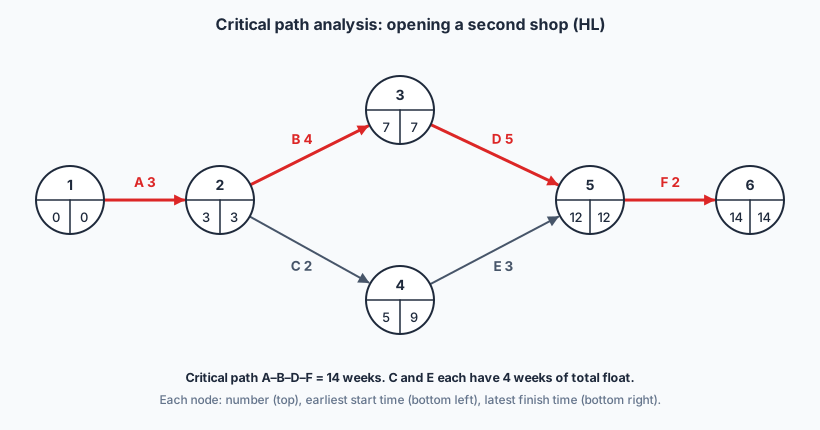
At node 5, two arrows meet: via D, 7 + 5 = 12; via E, 5 + 3 = 8. Take the larger, 12. Working back, the LFT at node 4 is 12 − 3 = 9. Float for C = 9 − 2 − 3 = 4 weeks; total float for E = 12 − 3 − 5 = 4 weeks. Critical activities have zero float.
Free float differs: for C it is 5 − 2 − 3 = 0 (any delay to recruiting delays the start of training), while for E it is 12 − 3 − 5 = 4 weeks. The 4 weeks of total float are shared along the C–E chain.
Uses: shows the minimum project time, which activities to monitor closely, where resources can be moved from (activities with float), and helps JIT ordering. Limitations: durations are estimates; complex for large projects; it plans but does not guarantee the project runs to plan.
Hofstede’s cultural dimensions
Geert Hofstede identified six dimensions on which national cultures differ. They help explain management, communication and marketing problems in multinational companies, mergers and international marketing (2.5, 4.6).
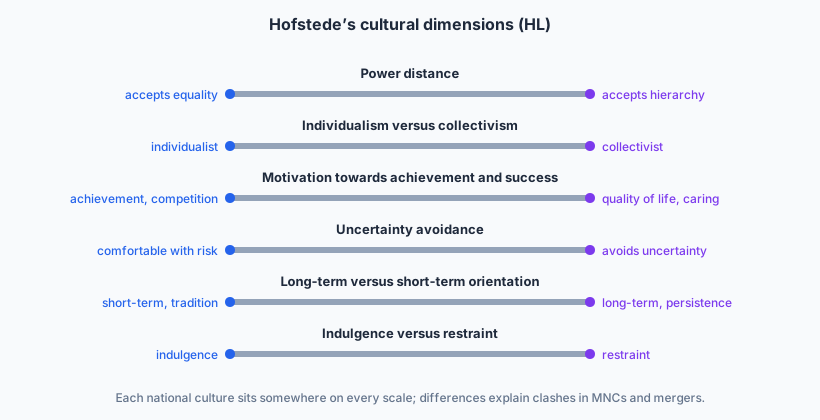
- Power distance: how far less powerful people accept unequal power. High: respect for hierarchy, autocratic or paternalistic leadership.
- Individualism versus collectivism: whether people look after themselves or belong to loyal groups. Collectivist cultures value team rewards and harmony.
- Motivation towards achievement and success (formerly masculinity versus femininity): competition and success versus caring and quality of life.
- Uncertainty avoidance: how uncomfortable people are with ambiguity; high scores prefer rules, plans and job security.
- Long-term versus short-term orientation: persistence and saving for the future versus tradition and quick results.
- Indulgence versus restraint: freedom to enjoy life versus control by strict social norms.
Limitations: generalizes about whole countries, ignoring regional and individual differences (Indonesia alone has hundreds of ethnic groups); based originally on one company’s employees; cultures change over time; risks stereotyping.
Contribution and absorption costing
Absorption (full) costing allocates all indirect (fixed) costs to products, for example in proportion to revenue or labour hours, to find each product’s profit. Contribution costing ignores fixed-cost allocation and judges each product by its contribution (revenue − variable costs), since fixed costs are paid whatever happens.
- Closing a product line: if a product makes a positive contribution, dropping it lowers total profit unless its fixed costs also disappear or the capacity can be used for something better.
- Special orders at a lower price: accept if price > variable cost, there is spare capacity, and regular customers will not demand the same price.
- Make or buy: compare cost to make with cost to buy (5.6).
Simple linear regression
A scatter diagram plots two variables to see whether they are related. The line of best fit (regression line) y = a + bx summarizes the relationship and can be used to forecast. The correlation coefficient r runs from −1 to +1: close to +1 is a strong positive relationship, close to 0 is none.
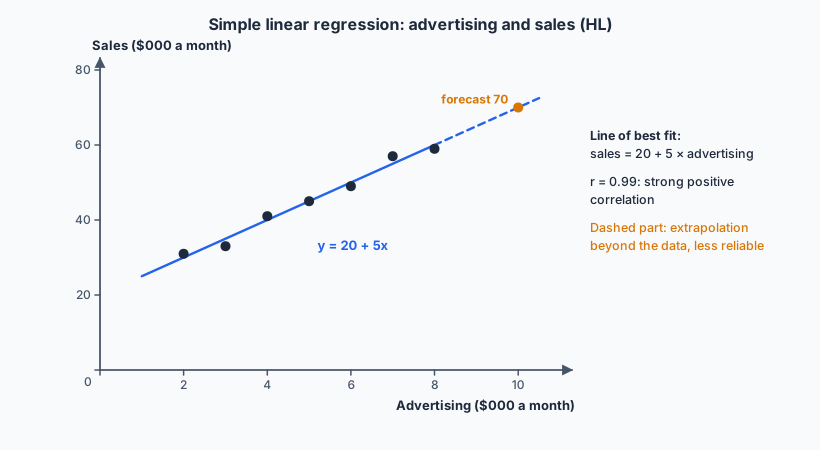
Limitations: correlation does not prove causation (sales and advertising may both rise in the high season); extrapolation assumes the relationship continues outside the data; outliers distort the line; other variables are ignored.
✏️Worked example
(a) Total revenue = 360 000. Fixed cost shares: longboards 150 × 120/360 = 50; shortboards 83.3; kids 16.7 ($000). Profit: longboards 50 − 50 = 0; shortboards 110 − 83.3 = 26.7; kids 10 − 16.7 = −6.7. Total = $20 000.
(b) Kids’ boards make a contribution of $10 000. If dropped, the $150 000 fixed costs remain and total profit falls to 160 − 150 = $10 000. Keep them, unless the capacity can earn more elsewhere; they may also build loyalty with families who later buy adult boards.
(c) Contribution per board = 450 − 300 = $150; 50 × 150 = $7500 extra profit, so accept on financial grounds, provided regular customers do not learn of the discount and demand it, and the boards do not damage the premium brand.
📝Practise
Work through these on paper, then reveal the answer.
1. [2 marks] Define the term critical path.
2. [2 marks] An activity lasts 4 days, starts at a node with EST 6 and ends at a node with LFT 13. Calculate its total float.
3. [2 marks] Using the regression line sales = 20 + 5 × advertising ($000), forecast sales at $6500 of advertising.
4. [4 marks] Explain how Hofstede’s power distance dimension could cause problems when a Dutch company takes over an Indonesian firm.
5. [4 marks] Explain two conditions under which a business should accept a special order below its normal price.
6. [10 marks] Using force field analysis, discuss whether a family-owned hotel should introduce performance-related pay.
Driving forces: motivate staff with money (Taylor), reward the best performers, link pay to guest reviews, attract talent.
Restraining forces: hard to measure individual performance in teamwork-based service; staff may see it as unfair; collectivist culture may prefer team rewards; administration cost; could harm cooperation; family owners’ paternalistic style.
Judgment: score the forces from the case; if restraints dominate, a team bonus linked to guest satisfaction may achieve the aim with less resistance. Scores are subjective, so involve staff in the analysis.
🔗Go deeper — other people’s work
These are external resources, not mine. If one stops working, tell me and everything above it on this page still stands.
- The Culture Factor (Hofstede Insights) — its country comparison tool shows the dimension scores for any two countries.
- Mind Tools — force field analysis and Gantt charts.
- Khan Academy — scatter plots, lines of best fit and correlation.